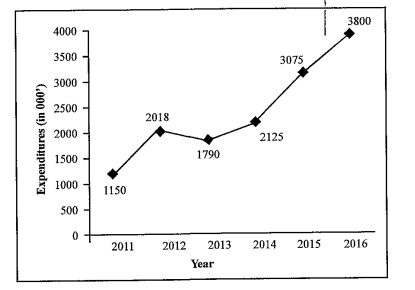
Expenditure in the year 2014 is what percent of the expenditure in year 2013?
118.71%
18.71%
115.76%
15.76%
The correct Answer is:A
Step by step video, text & image solution for Expenditure in the year 2014 is what percent of the expenditure in year 2013? by Maths experts to help you in doubts & scoring excellent marks in Class 14 exams.
Updated on:21/07/2023Similar Questions
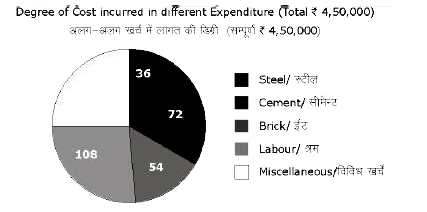
In the given pie chart the expenditure on steel is what percent of the expenditure on cement
View SolutionThe pie-chart represents the profits earned by a certain company in seven consecutive years. Study the pie-chart carefully and answer the question.
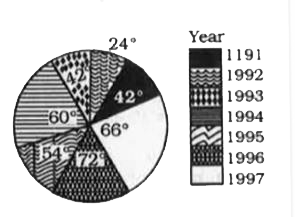
If the expenditure in the year 1993 was 30% more than the expenditure in the year 1991, then the income in the year 1993 exceeds the income in the year 1991 by 30% of
View Solution
Knowledge Check
The table below shows the number of students enrolled in five colleges over the five years
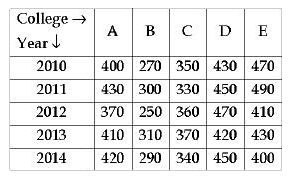
In the year 2014 what percent of students were enrolled in college CA16.9B17.8C16.7D19.1the given bar graph presents income and Expenditure of a company for the five years, 2014 to 2018
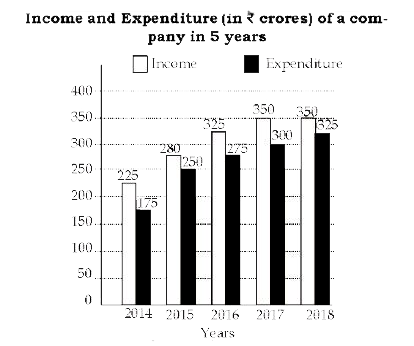
The average income of the company in five years in what percentage more than its expenditure in 2015?A24.2B20.8C24.6D22.4Study the following table and answer the question. Expenditures of a Company in Lakh Rupees) per annum over the given years.
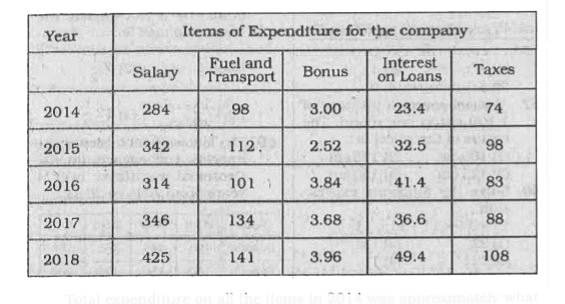
Total expenditure on all the items in 2014 was approximately what percent of the total expenditure in 2018?A0.6032B0.6632C0.6832D0.6532
Study the following graph carefully to answer the questions given below. Expenditure in lakhs) of three different Companies in Five Different Years
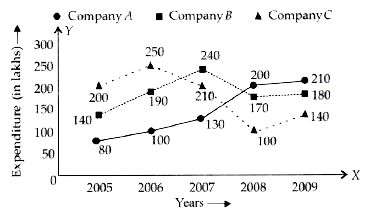
Total expenditure of all the three companies together in the year 2006 was what Percentage of the total expenditure of Company A over all the years together?
View SolutionStudy the following table and answer the question. Expenditures of a Company in Lakh Rupees) per annum over the given years.

Total expenditure on all the items in 2014 was approximately what percent of the total expenditure in 2018?
View SolutionThe given pie chart shows expenditure on different type of sport in a particular year. Study the pie chart and answer the question below
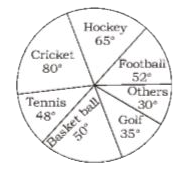
Expenditure on hockey was how much percent more than expenditure on basketball.
View SolutionA company's expenditure heads are given as follows (all figures are in lakhs of rupees)
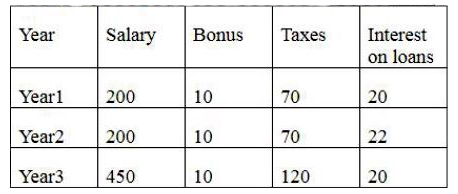
Total expenditure of Year 1 was approximately what percent of total expenditure of Year 3 ?
View SolutionThe given Bar Graph presents Income and Expenditure (in crores of Rupees) of a company for the five years, 2014 to 2018.
Income and Expenditure (in a crores) of a company in 5 Years
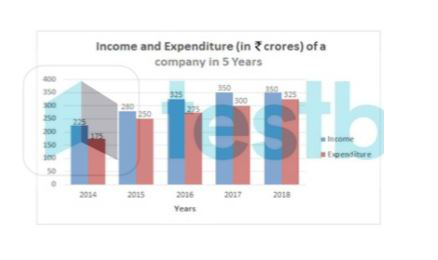
The average Income (per year) of the company in five years is what percentage more than its Expenditure in 2015?
View Solution
