Given below is a pie chart showing the time spend by a group of 350 children in different games. Observe it and answer the questions that follow.
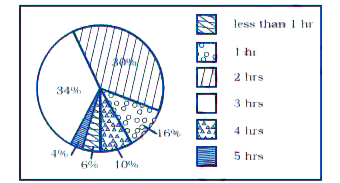
How many children spend at least one hour in playing games?
327
328
329
330
The correct Answer is:C
Step by step video & text solution for Given below is a pie chart showing the time spend by a group of 350 children in different games. Observe it and answer the questions that follow. How many children spend at least one hour in playing games? by Maths experts to help you in doubts & scoring excellent marks in Class 14 exams.
Updated on:21/07/2023Similar Questions
Given below is a pie chart showing the time spend by a group of 350 children in different games. Observe it and answer the questions that follow.

How many children spend 3 or lesser hours in playing games?
View SolutionGiven below is a pie chart showing the time spend by a group of 350 children in different games. Observe it and answer the questions that follow.
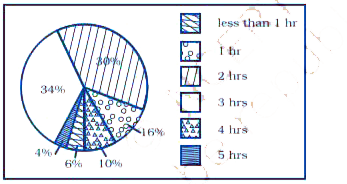
How many children spend more than 2 hours in playing games?
View Solution
Knowledge Check
The given pie chart shows the percentage distribution of 450 employees in an organisation. Study the pie chart and answer the question that follows
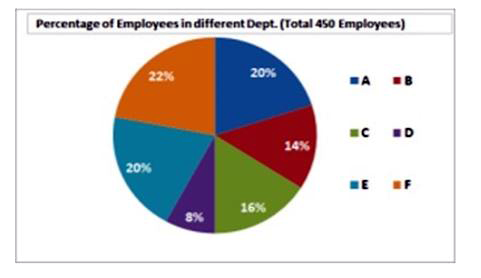
If 60% of the employees in department E are females, how many male employee are there in that department ?A18B54C72D36
Given below is a pie chart showing the time spend by a group of 350 children in different games. Observe it and answer the questions that follow.

Which is greater — number of children who spend 2 hours or more per day or number of children who play for less than one hour?
View SolutionThe pie chart on the right shows the result of a survey carried out to find the modes of travel used by the children to go to school. Study the pie chart and answer the questions that follow.
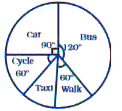
If 18 children travel by car, How many children use taxi to travel to school?
View SolutionSuppose n different games are to be given to n children. In how many ways can this be done so that eactly one child gets no game.
View SolutionThe pie chart on the right shows the result of a survey carried out to find the modes of travel used by the children to go to school. Study the pie chart and answer the questions that follow.
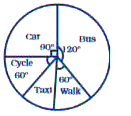
If 18 children travel by car, how many children took part in the survey?
View SolutionThe pie chart on the right shows the result of a survey carried out to find the modes of travel used by the children to go to school. Study the pie chart and answer the questions that follow.
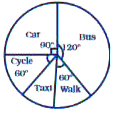
What fraction of children travel by car?
View SolutionThe pie chart on the right shows the result of a survey carried out to find the modes of travel used by the children to go to school. Study the pie chart and answer the questions that follow.
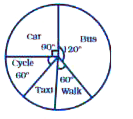
What is the most common mode of transport?
View SolutionThe pie chart on the right shows the result of a survey carried out to find the modes of travel used by the children to go to school. Study the pie chart and answer the questions that follow.

By which two modes of transport are equal number of children travelling?
View Solution
