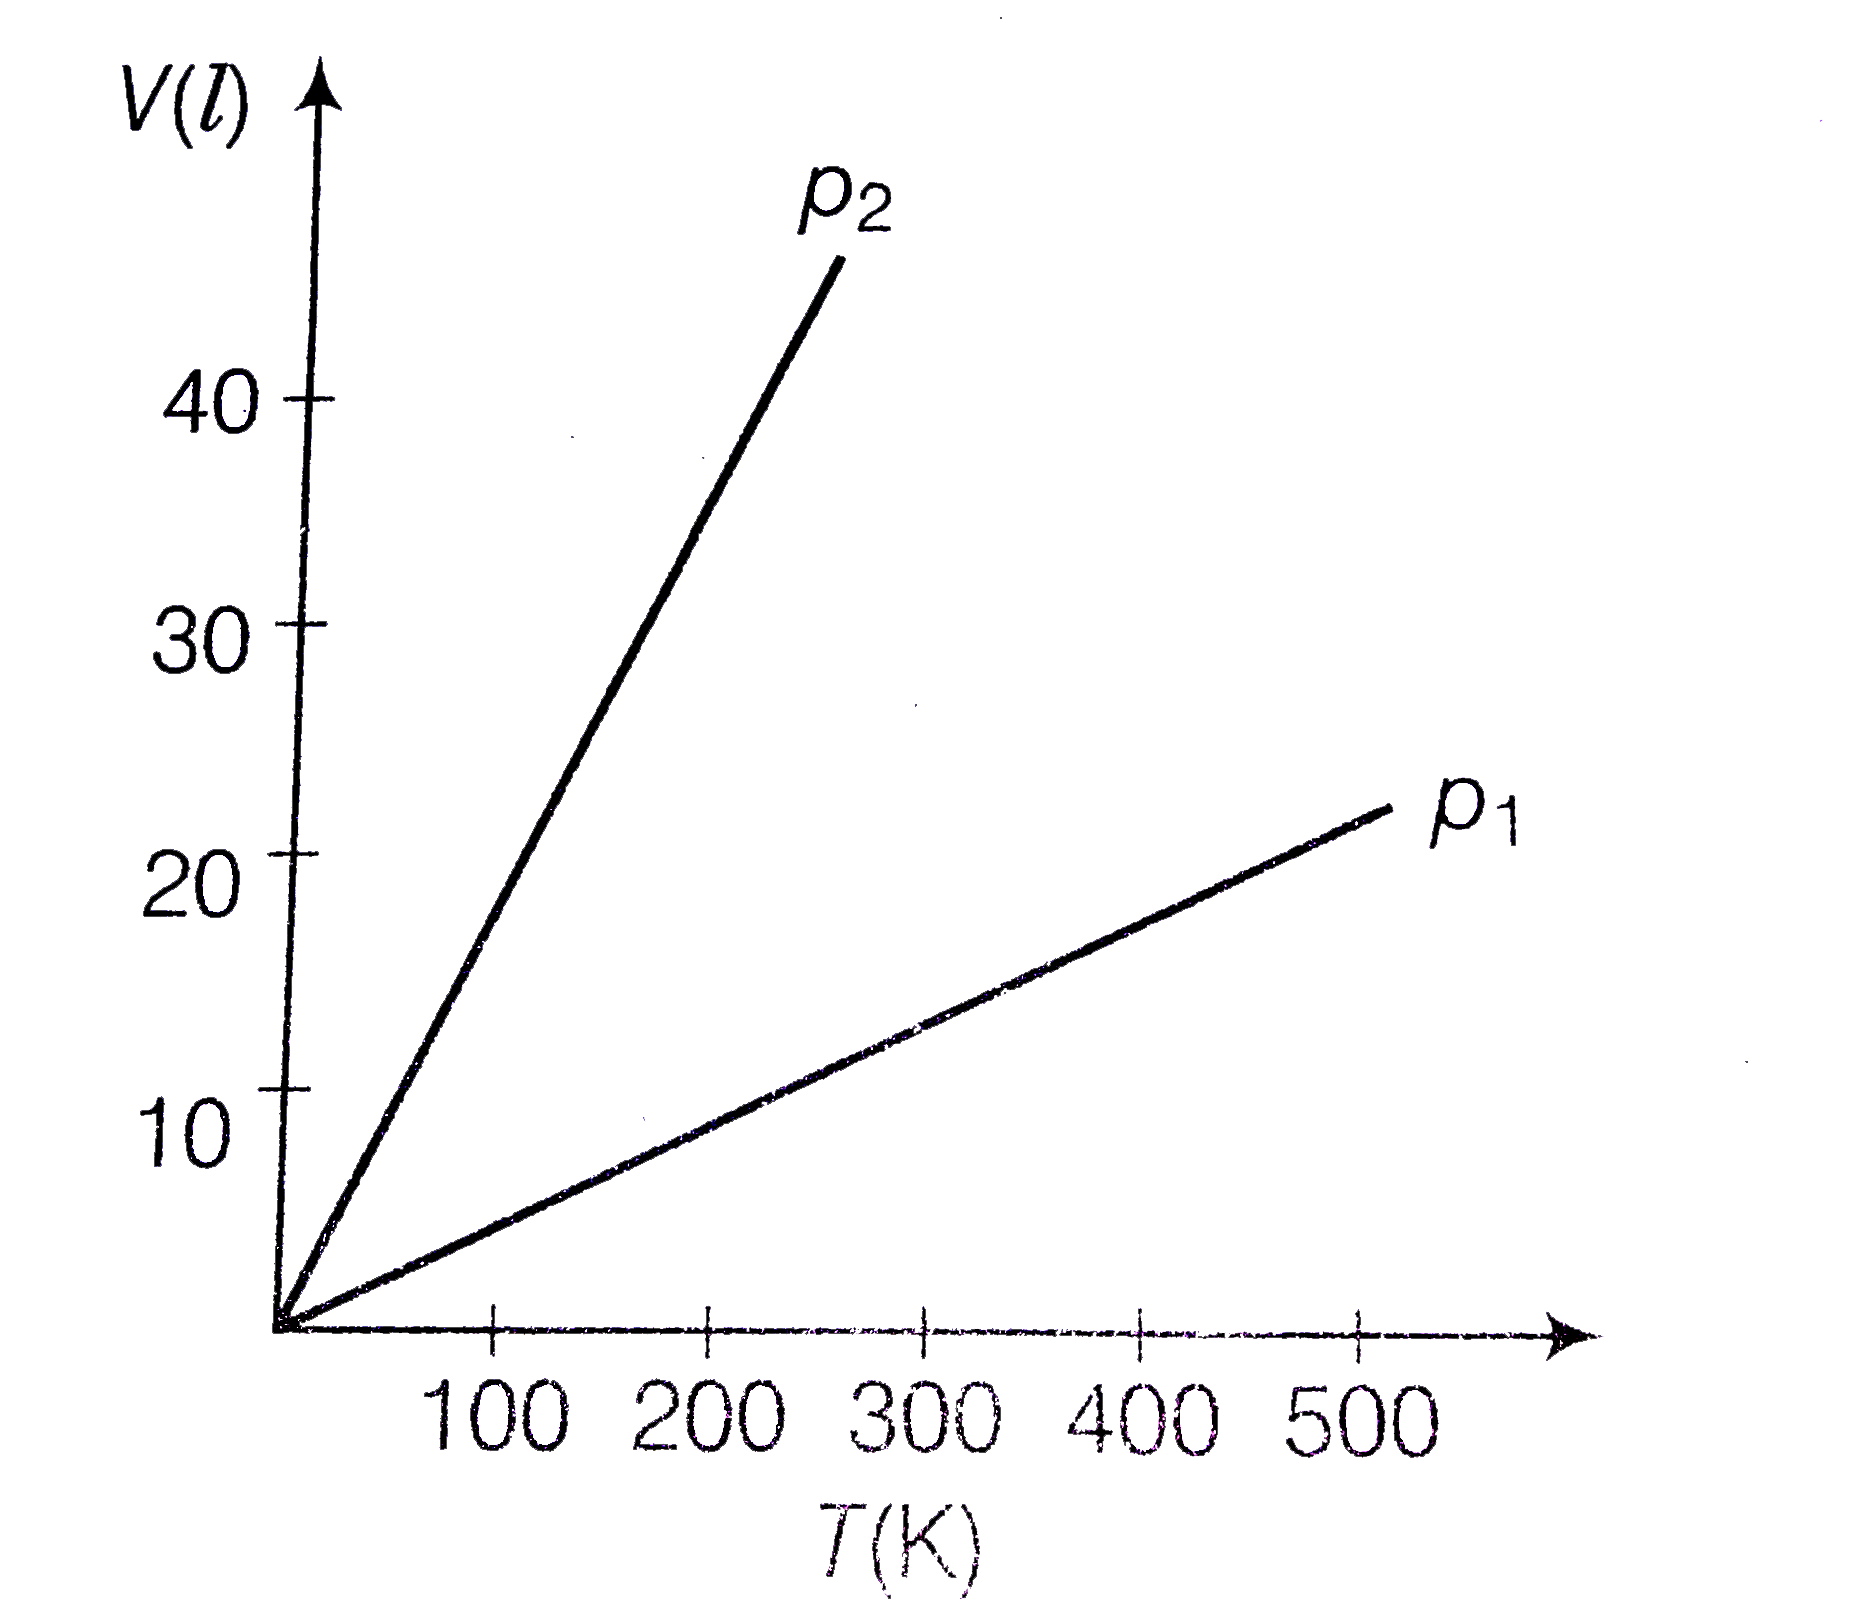
For an ideal gas V−T curves at constant pressure P1 & P2 are shown in figure, from the figure
_E01_061_Q01.png) Solution in Telugu
Solution in Telugu
P1>P2
P1<P2
P1=P2
All of these
The correct Answer is:b
(b) 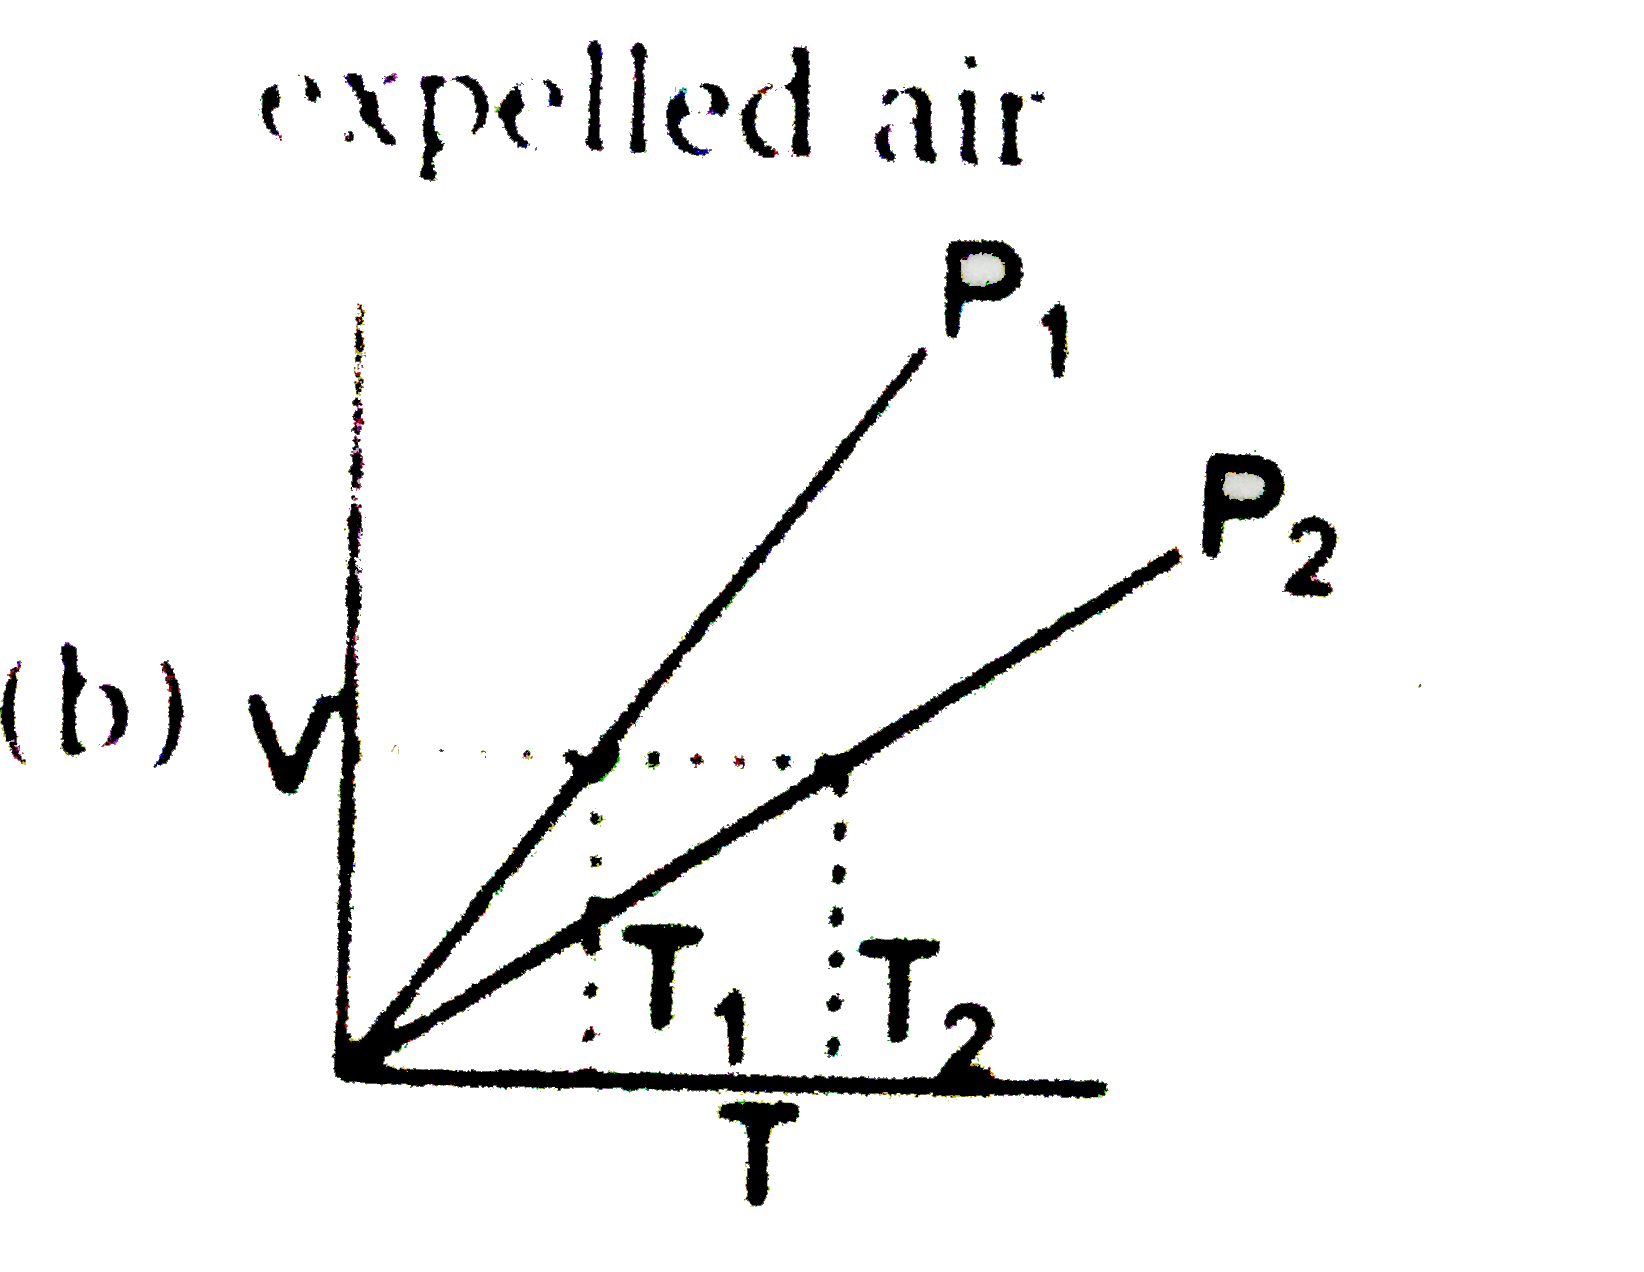
PV=nRT
n, V =constant
P∝T
T2>T1
P2>P1
Topper's Solved these Questions
- GASEOUS STATEBOOK - NARENDRA AWASTHICHAPTER - GASEOUS STATEEXERCISE - Level 1 (Q.31 To Q.60)
1 Videos
- GASEOUS STATEBOOK - NARENDRA AWASTHICHAPTER - GASEOUS STATEEXERCISE - Level 1 (Q.121 To Q.150)
1 Videos
- ELECTROCHEMISTRYBOOK - NARENDRA AWASTHICHAPTER - ELECTROCHEMISTRYEXERCISE - Level 3 - Subjective Problems
1 Videos
- IONIC EEQUILIBRIUMBOOK - NARENDRA AWASTHICHAPTER - IONIC EEQUILIBRIUMEXERCISE - Assertin-Reason Type Questions
1 Videos
Similar Questions
Nitrogen forms several gaseous oxides. One of them has a density of 1.33 g/L measured 764 mmHg and 150∘C. Write the formula of the compound.
View SolutionDimethyl ether decomposes as
CH3OCH3(g)→CH4(g)+CO(g)+H2(g)
When CH3OCH3(g) decomposes to 20% extent under certain conditions, what is the ratio of diffusion of pure CH3OCH3(g) with methane?
View SolutionA solution containing 1MXSO4(aq) and 1MYSO4(aq) is electrolysed. If conc. Of X2+ is 10−zM when deposition Y2+ and X2+ starts simultaneously, calculate the value of Z.
Given: 2.303RTF=0.06
E∘x2+|X=−0.12V,E∘Y2+|Y=−0.24V
View SolutionSTATEMENT-1: All strong monoprotic acid with same concentration in dilute solution show same pH.
STATEMENT-2: Water shows levelling effect.
View SolutionV vs T curves at different pressures P_(1) and P_(2) for an ideal gas are shown below: Which one of the following is correct?
View SolutionFor an ideal gas V - T curves at constant pressure P_(1) & P_(2) are shown in figure, from the figure
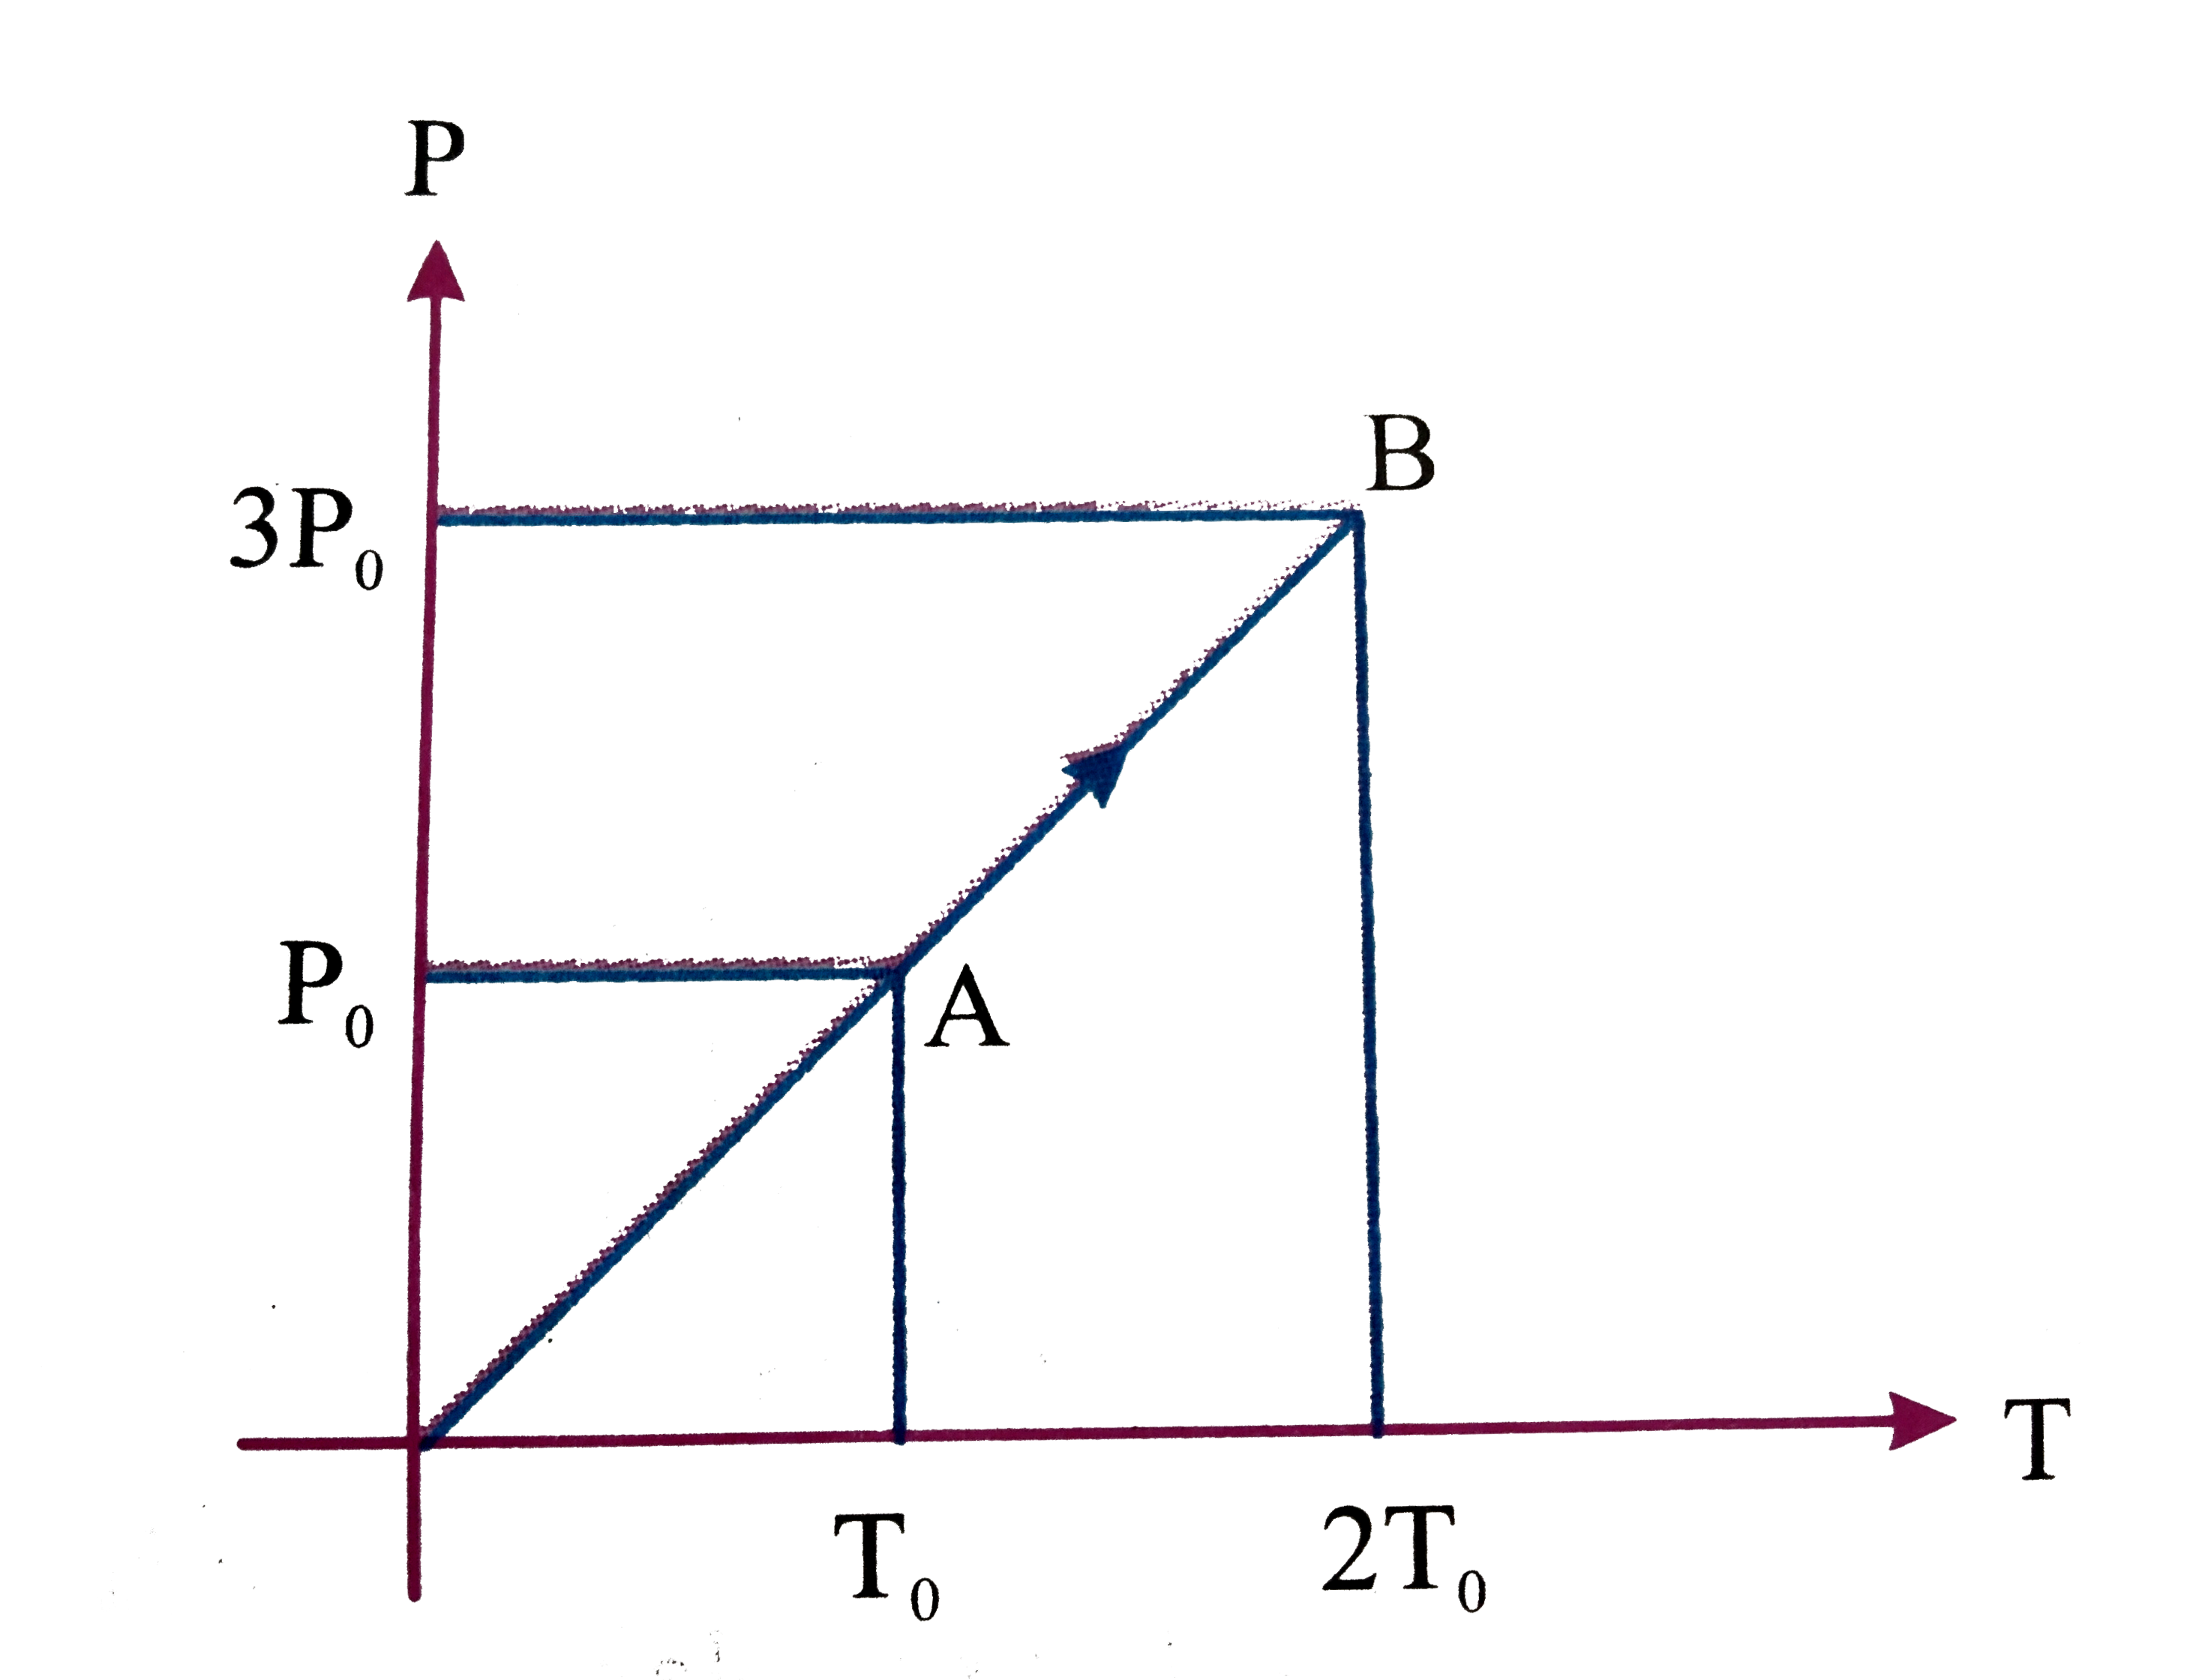
View SolutionPressure versus temperature graph of an ideal gas is shown in figure. Density of the gas at point A is P0. Density at B will be
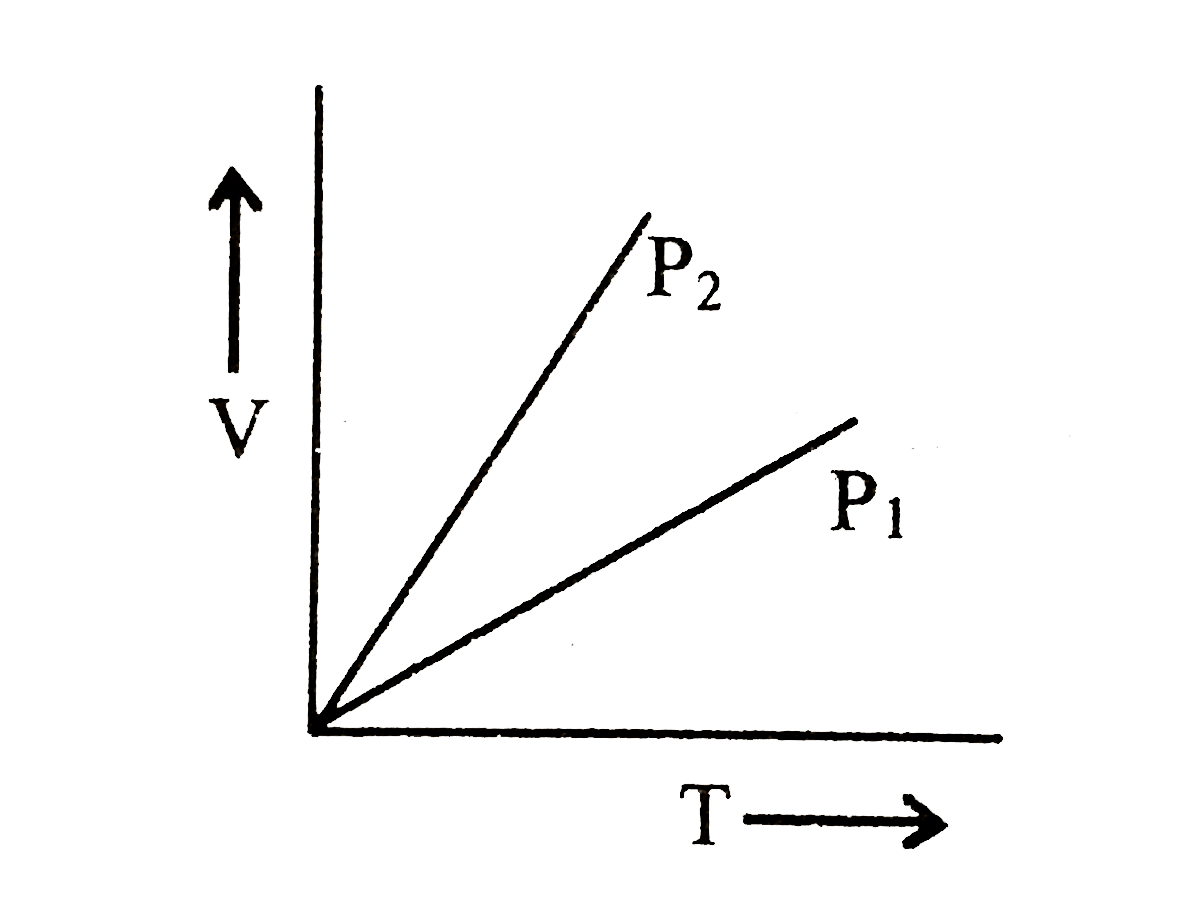
View SolutionFor V versus T curves at constant pressure P1andP2 for and ideal gas shown in figure-
View SolutionV vs T curves at constant pressure P1 and P2 for an ideal gas are shown below
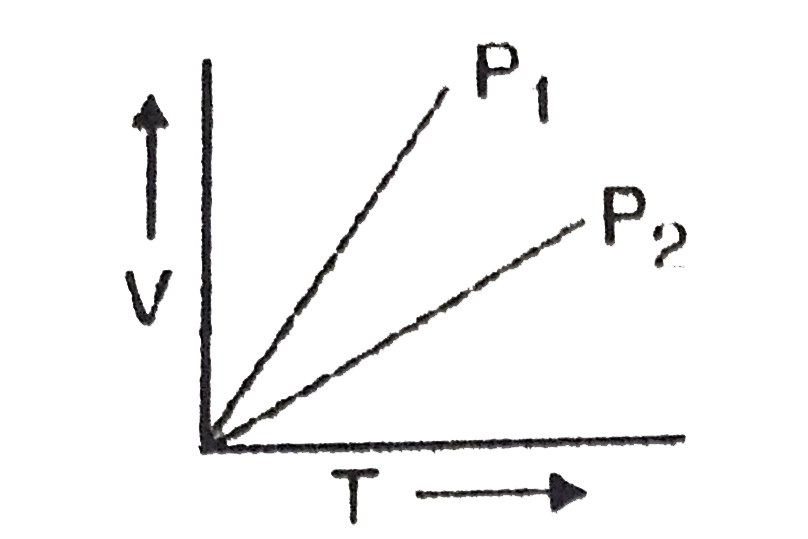
Which is correct ?
View SolutionVolume versus temperature graphs for a given mass of an ideal gas are shown in figure. At two different values of constant pressure. What can be inferred about relation between P1 and P2 ?
View SolutionVolume versus temperature graphs for a given mass of an ideal gas are shown in figure. At two different values of constant pressure. What can be inferred about relation between P1 and P2 ?

View SolutionFor an ideal gas V−T curves at constant pressure P1 & P2 are shown in figure, from the figure
_E01_061_Q01.png)
View SolutionVolume versus temperature graphs for a given mass of an ideal gas are shown in figure. At two different values of constant pressure. What can be inferred about relation between P_(1) and P_(2) ?
View SolutionFor an ideal gas V-T curves as constant pressures P1&P2 are shown in figure - from the figure
View SolutionVolume versus temperature graphs for a given mass of an ideal gas are shown in figure. At two different values of constant pressure. What can be inferred about relation between P_(1) and P_(2) ?
View SolutionV vs T curves at different pressures P1 and P2 for an ideal gas are shown below:

Which one of the following is correct?
View Solution
