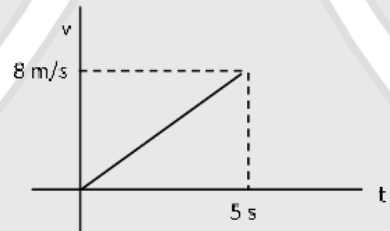
Figure a represents the speed-time graph for a particle .Find the distance covered by the particle betweent=10 min and t= 30 min .

We draw perpendicular lines from the 10-minute point and the 30-minute point to the time -axis (Figure b). The distance covered is equal to area of the rectangle ABCD. It s value is
AB.AD=(30min−10min)×(10km/h)
=20min×10km/h
h=2060h×10km/h
=103km
Similar Questions
Knowledge Check
The speed-time graph of a particle moving along a fixed direction is shown in the Fig. 2 (CF) . 15. The distance traversed by the particle between t=2s and 6s is .
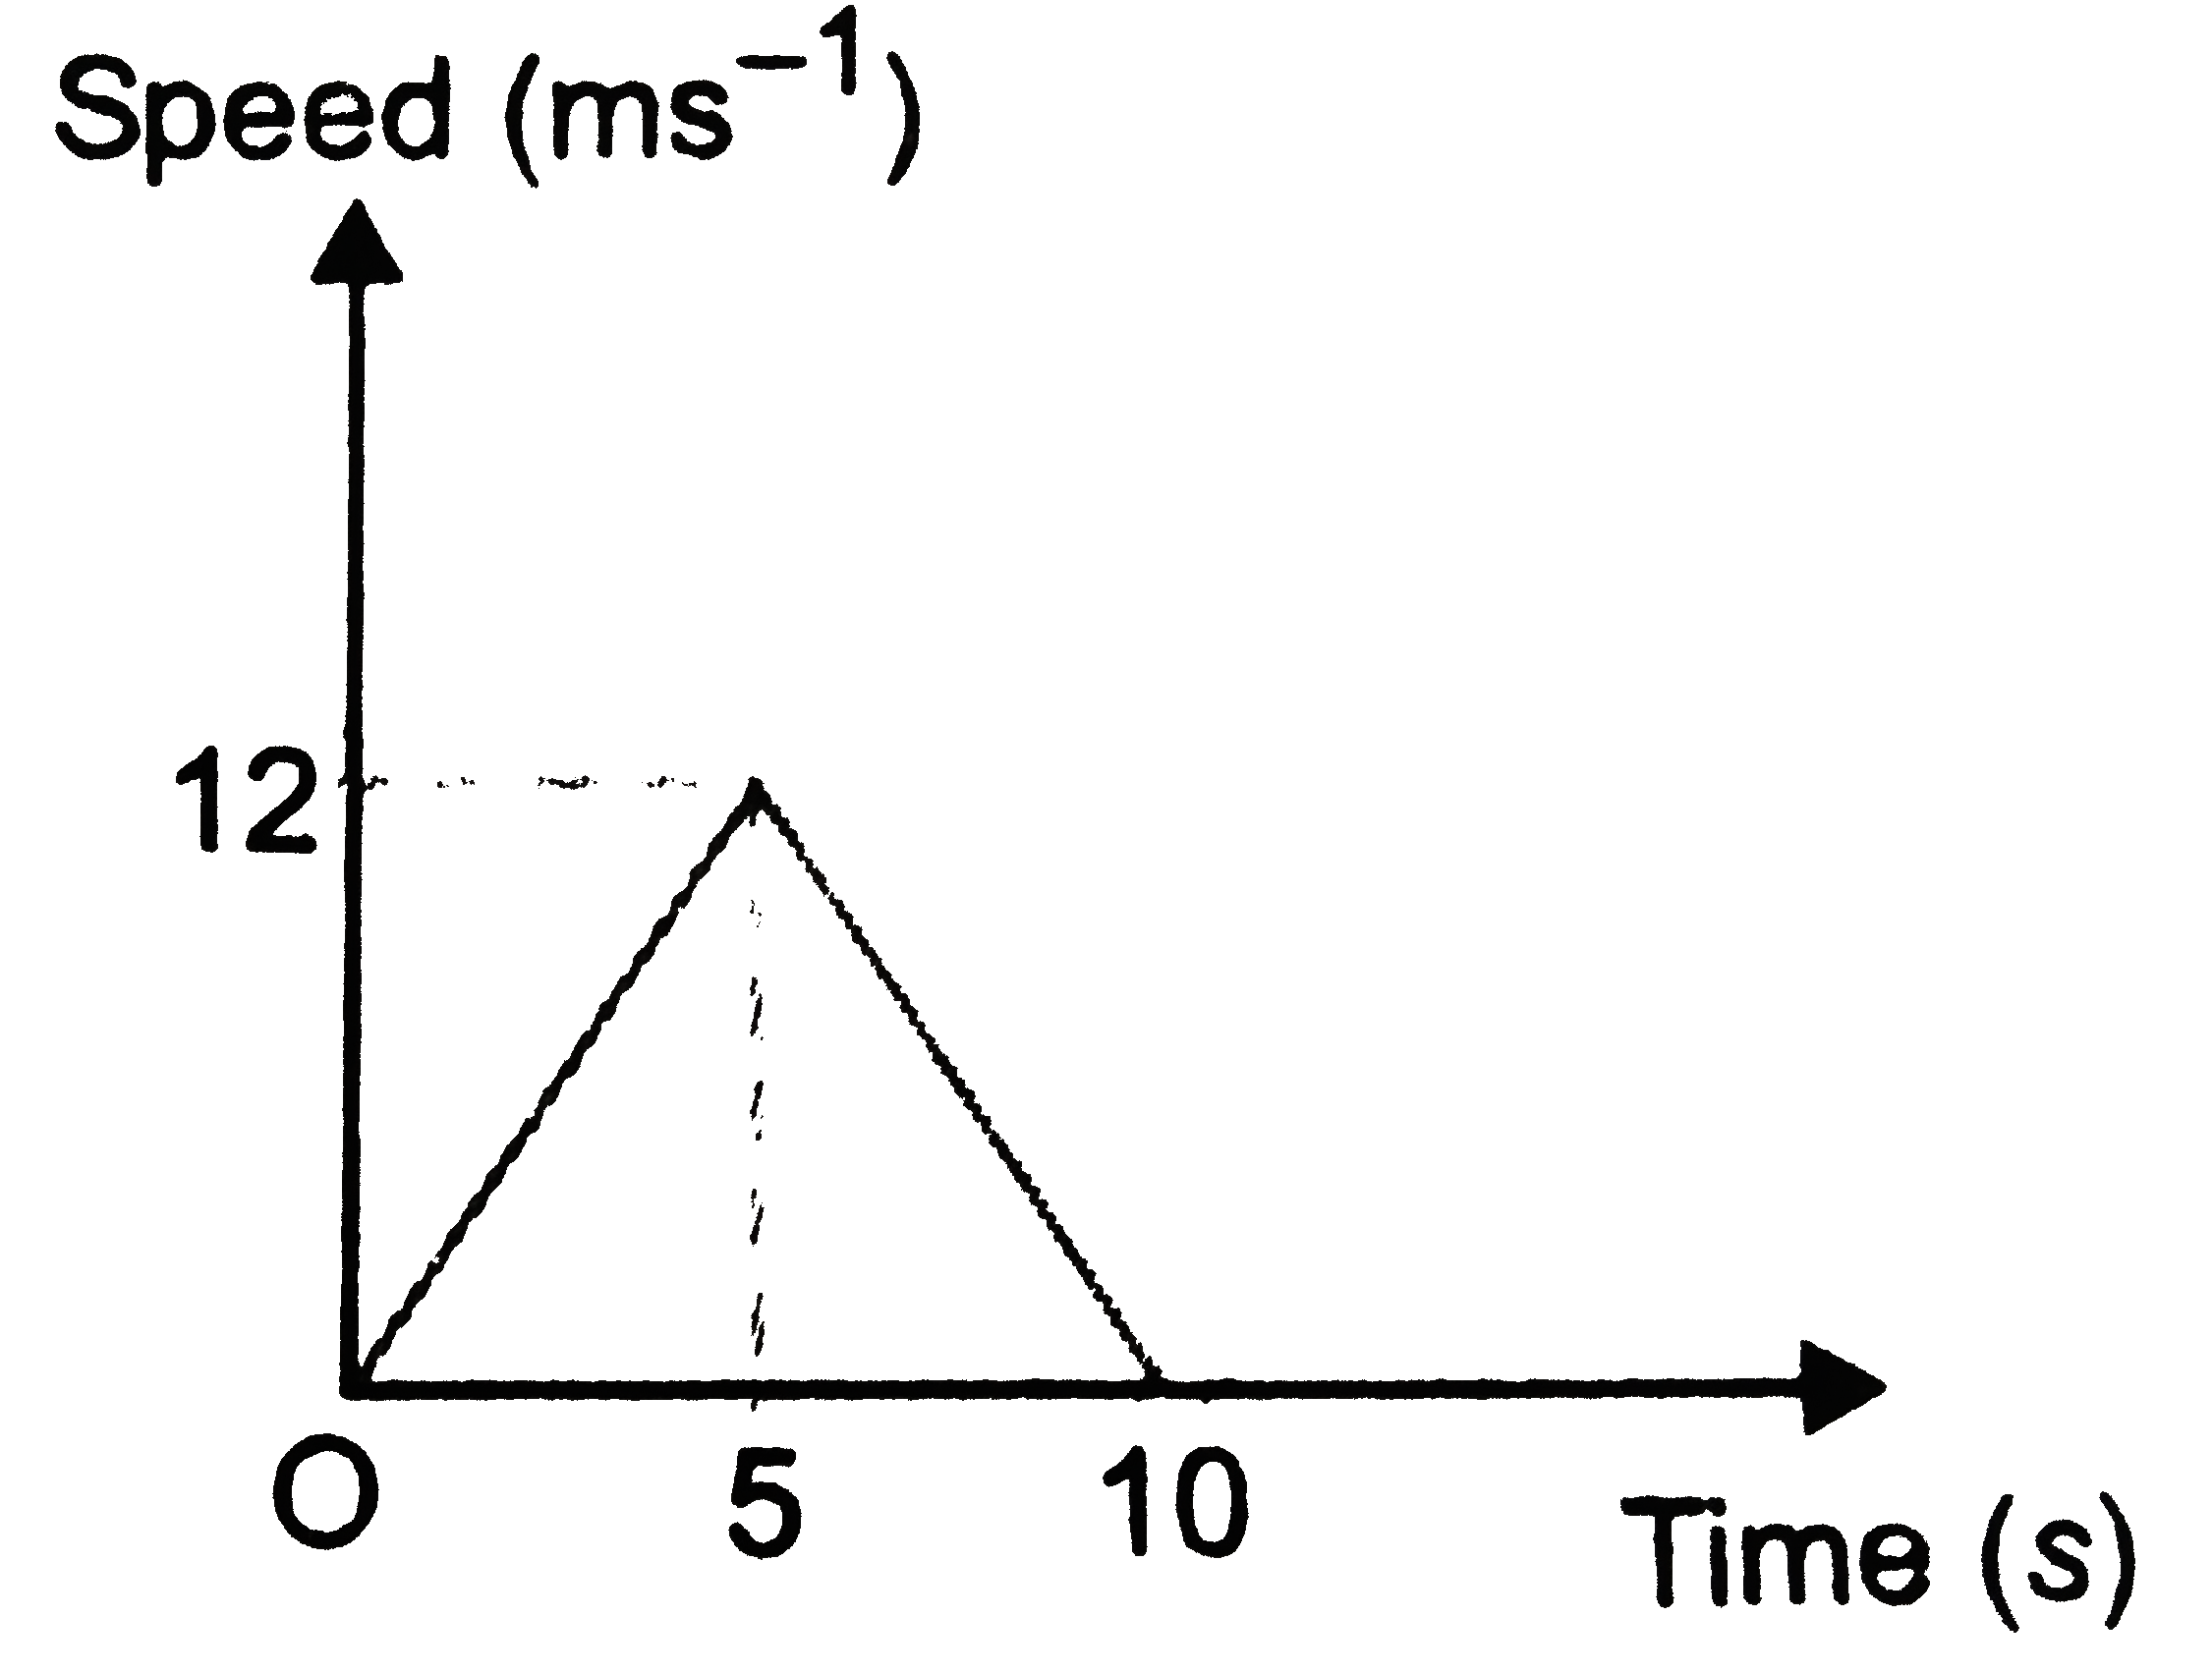 .A1. 26 mB2. 36 mC3. 46 mD4. 56 m
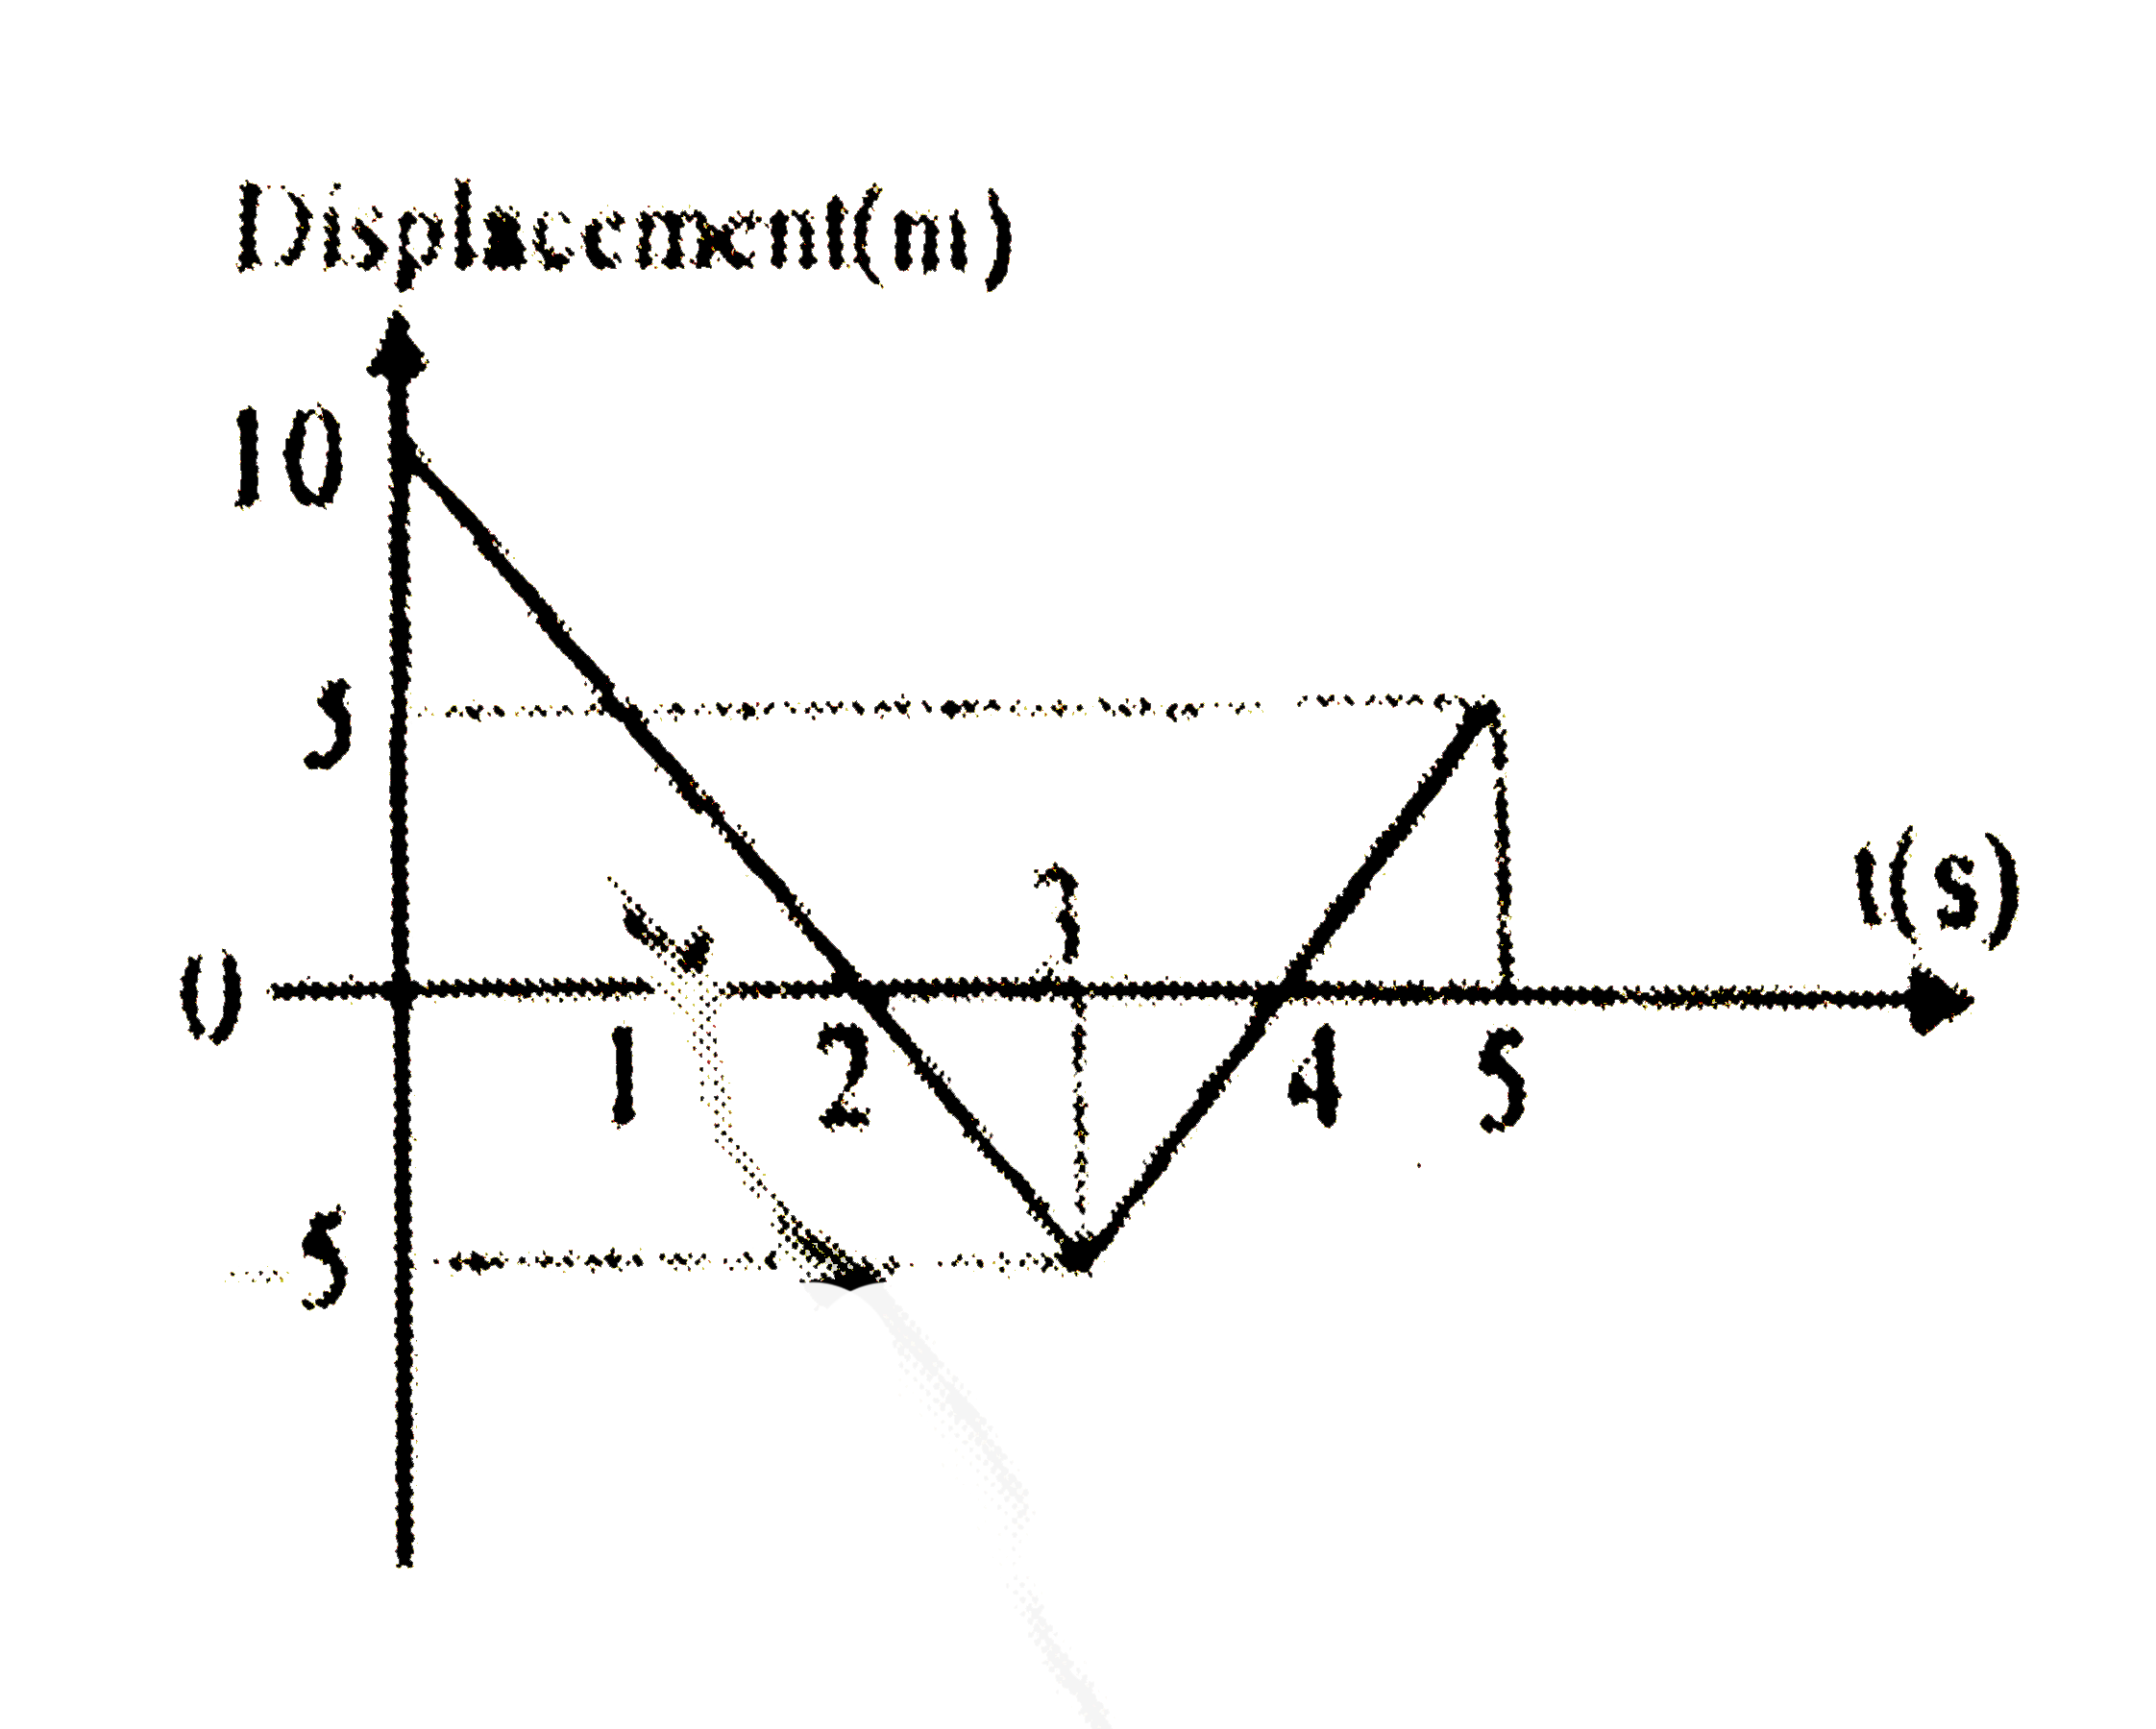
The diagram shows the displacement - time graph for a particle moving in a straight line. The distance (in m) coverted by the particle in the time interval t=0 to t=5s is
View SolutionThe speed verses time graph for a particle is shown in the figure. The distance travelled (in m) by the particle during the time interval t = 0 to t = 5 s will be __________
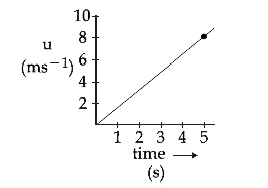
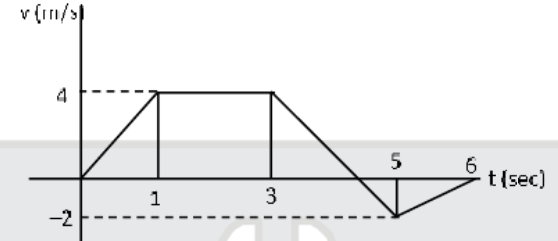
View Solutionvelocity time graph of a particle is shown in figure. Find displacement of the particle.
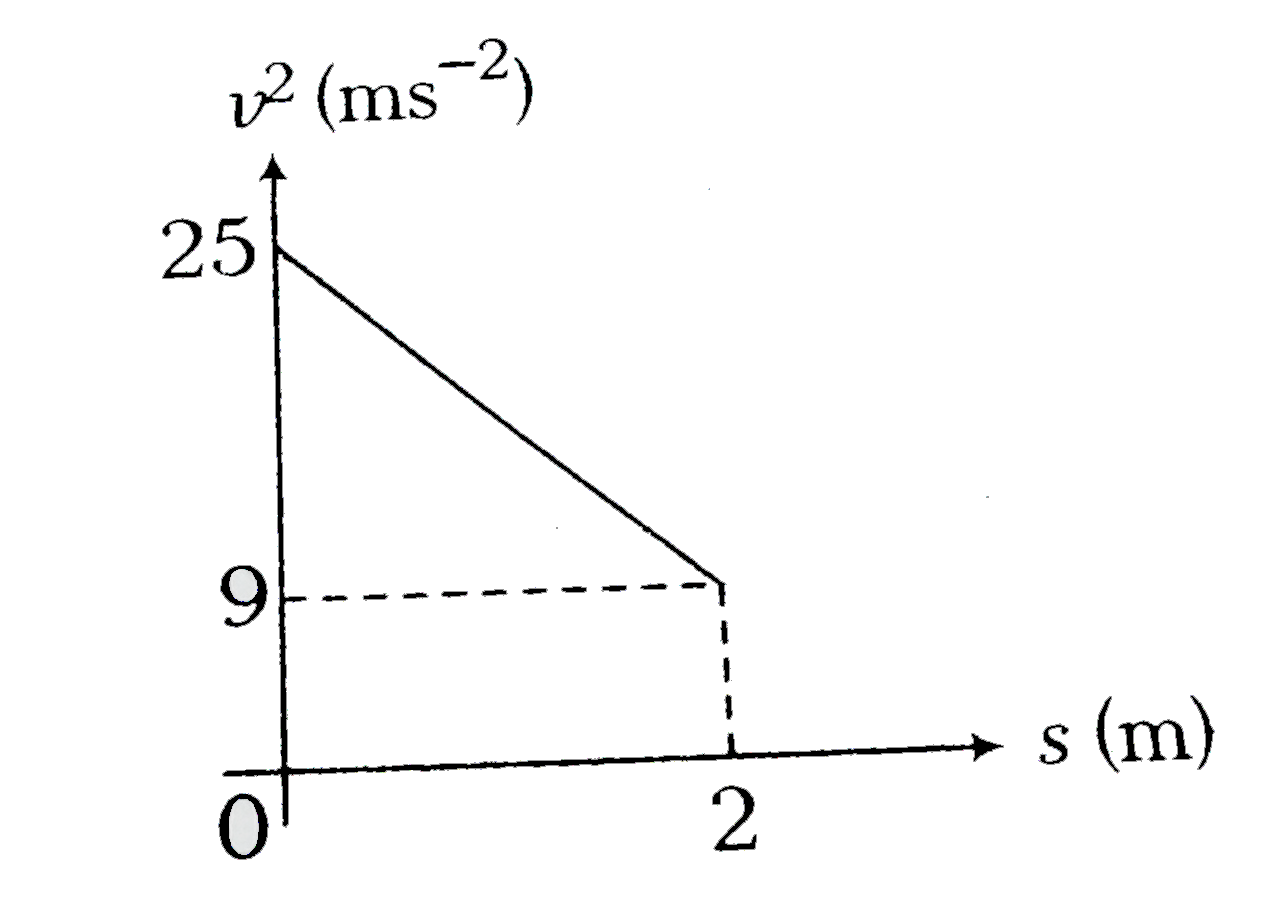
View SolutionA graph between the square of the velocity of a particle and the distance s moved by the particle is shown in the figure. The acceleration of the particle is
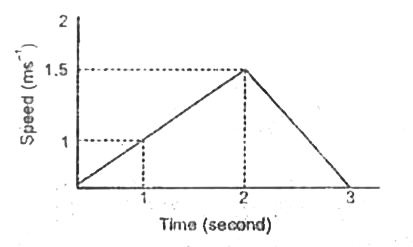
View SolutionThe speed - time graph of a particle moving along a solid curve is shown below. The distance traversed by the particle from t = 0 to t = 3 is
View SolutionFigure shows x-t graph of a particle. Find the Time T such that the average velocity of the particle during the period 0 to T is Zero.

View SolutionA particle is constrained to move on a straight line path. It returns to the starting point after 10 sec . The total distance covered by the particle during this time is 30 m . Which of the following statements about the motion of the particle is false
View Solution

