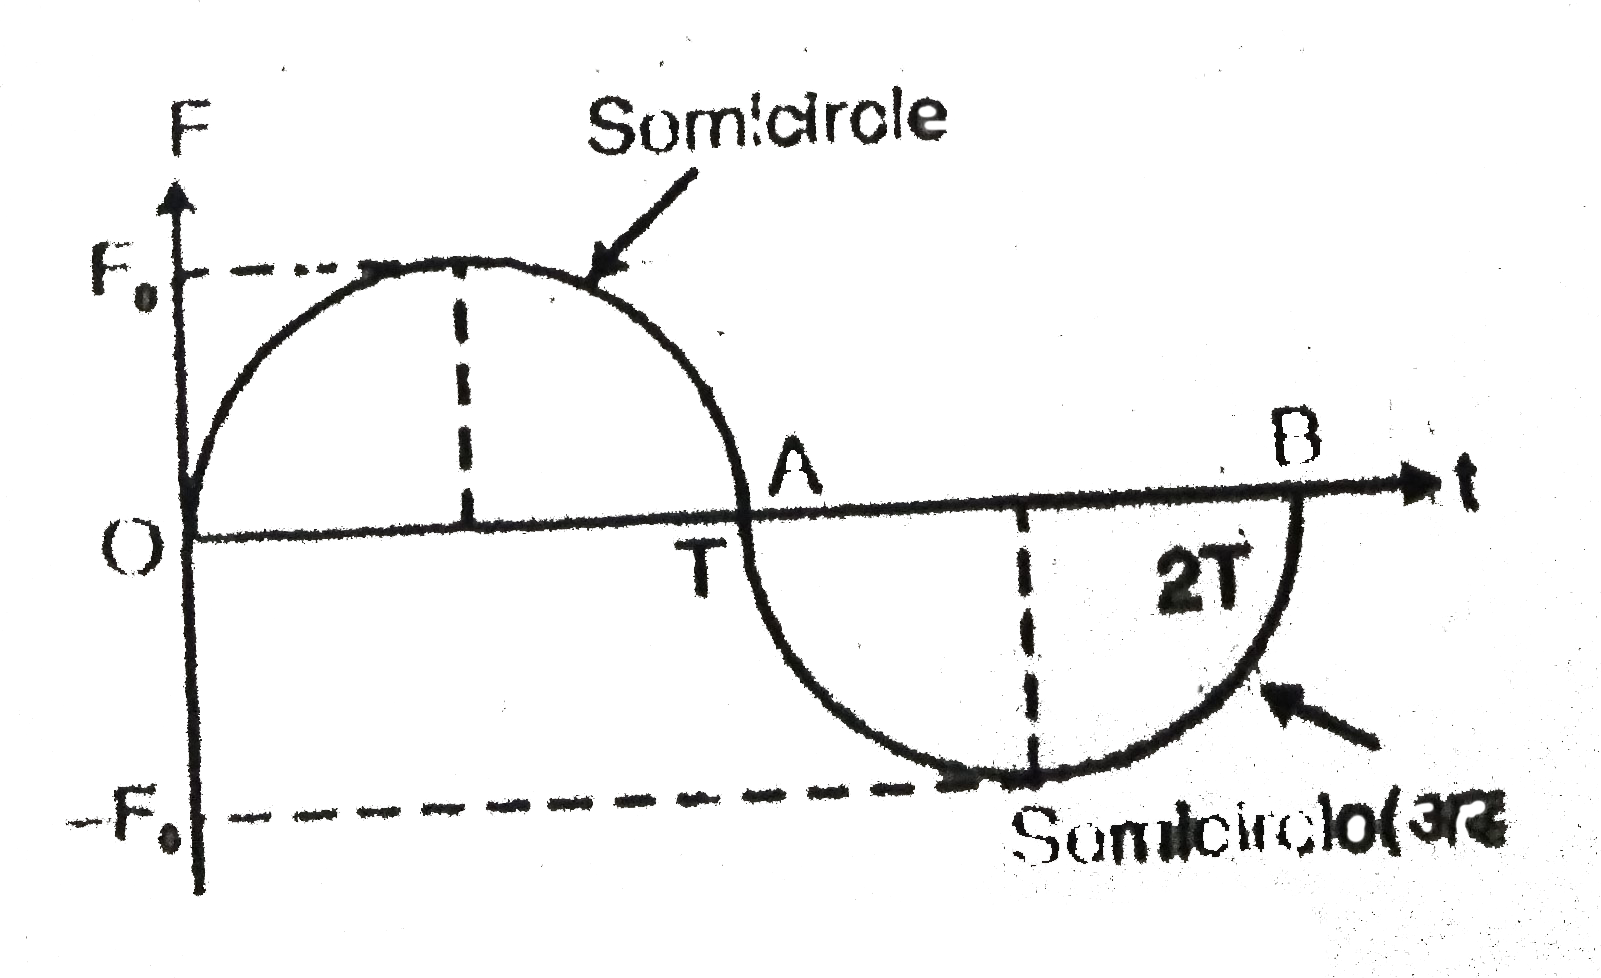
A force F varies with time in accordance with the following figure. The mean force for one cycle:

F0
F0/2
2F0
Zero
The correct Answer is:D
Step by step video solution for A force F varies with time in accordance with the following figure. The mean force for one cycle: by Physics experts to help you in doubts & scoring excellent marks in Class 11 exams.
Updated on:21/07/2023Similar Questions
A one-dimensional force F varies with time according to the given graph. Calculate impulse of the force in following time intervals.
(a) From t=0s to t=10s.
From t=10s to t=15s.
(C) From t=0s to t=15s.
View SolutionThe current (I) in the inductance is varying with time according to the plot shown in figure.
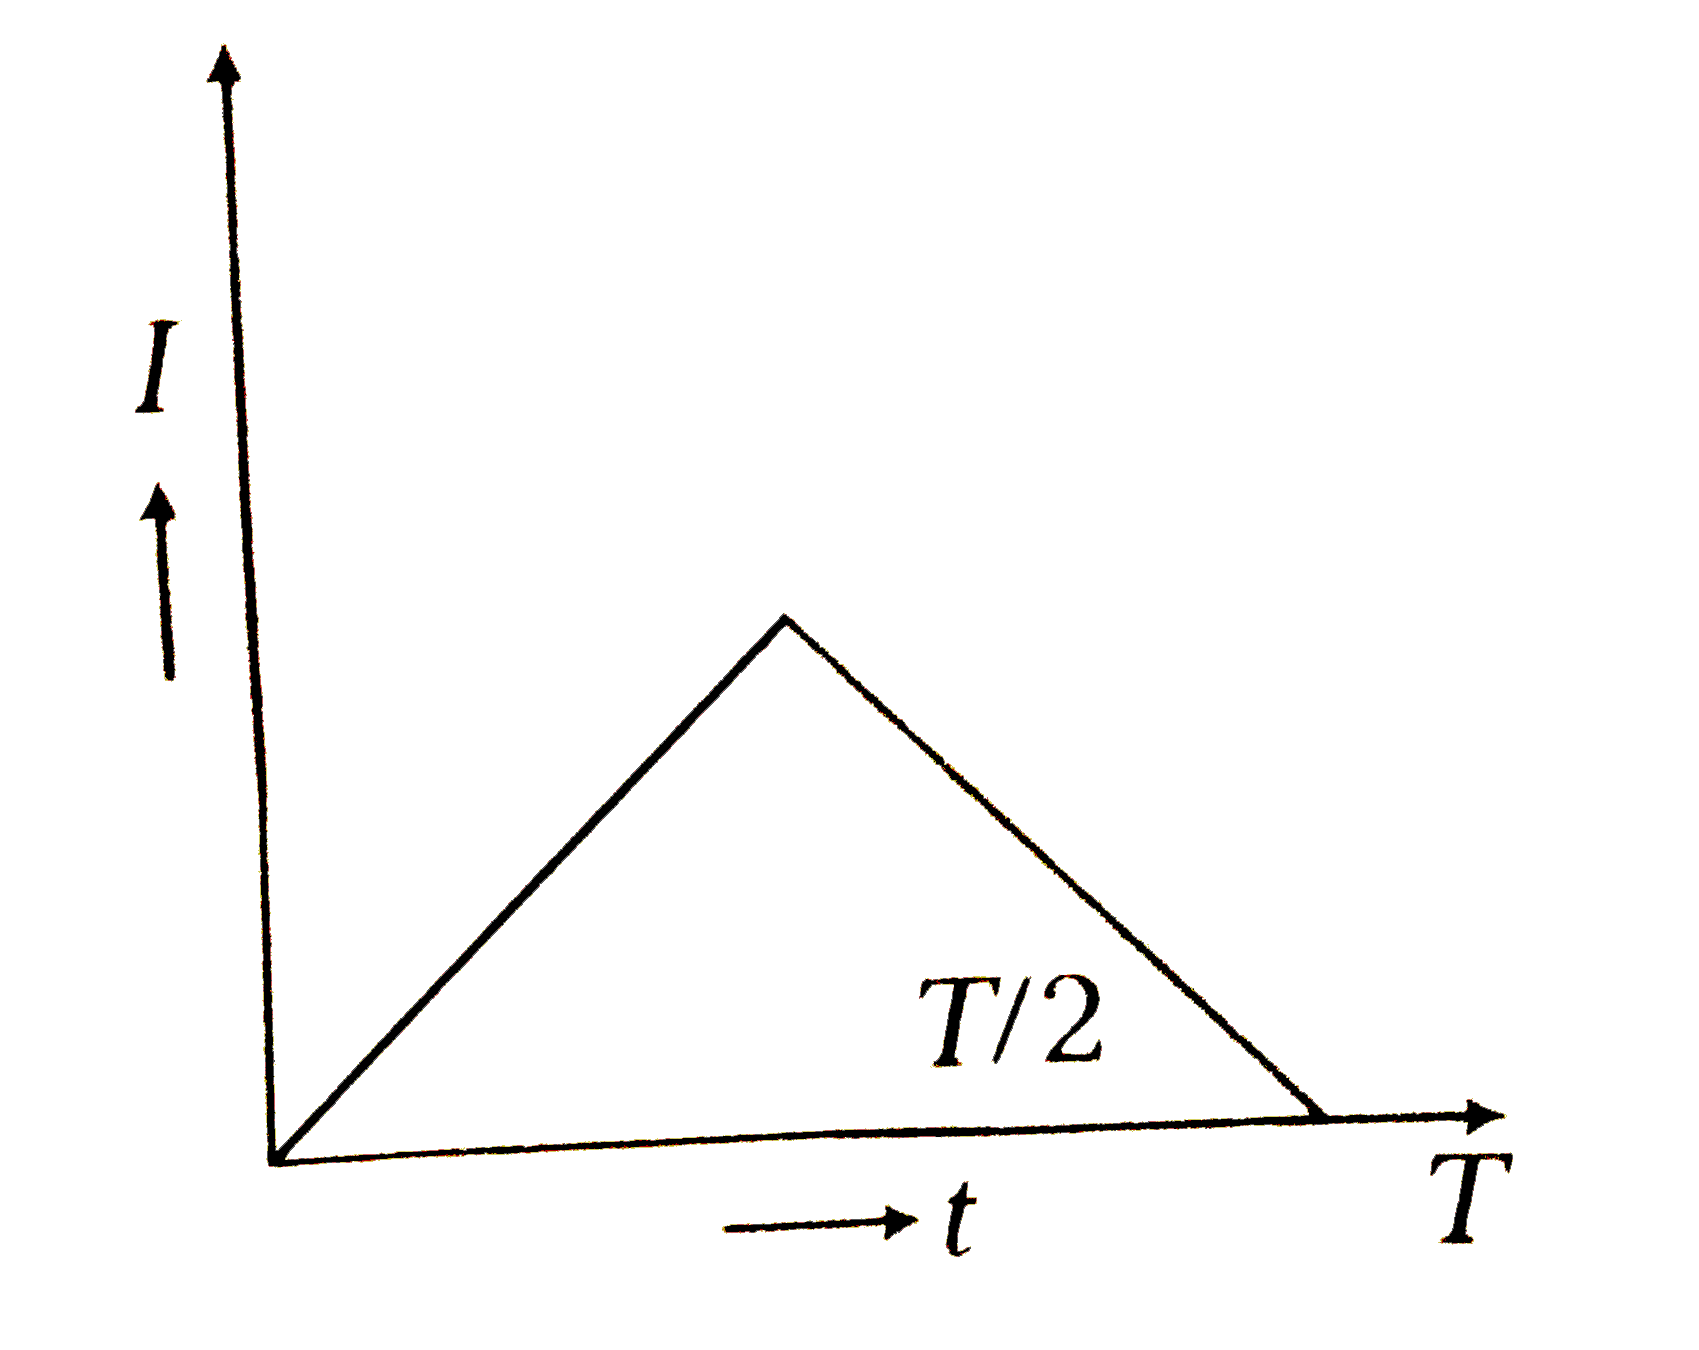
Which one of the following is the corrcet variation of voltage with time in the coil ?
View Solution
Knowledge Check
Which one of the following is not force
AimpulseBTensionCThrustDWeightA force F acting on an object varies with distance x as shown in the figure. The work done by the force in moving the object from x=0 to x = 20 m is
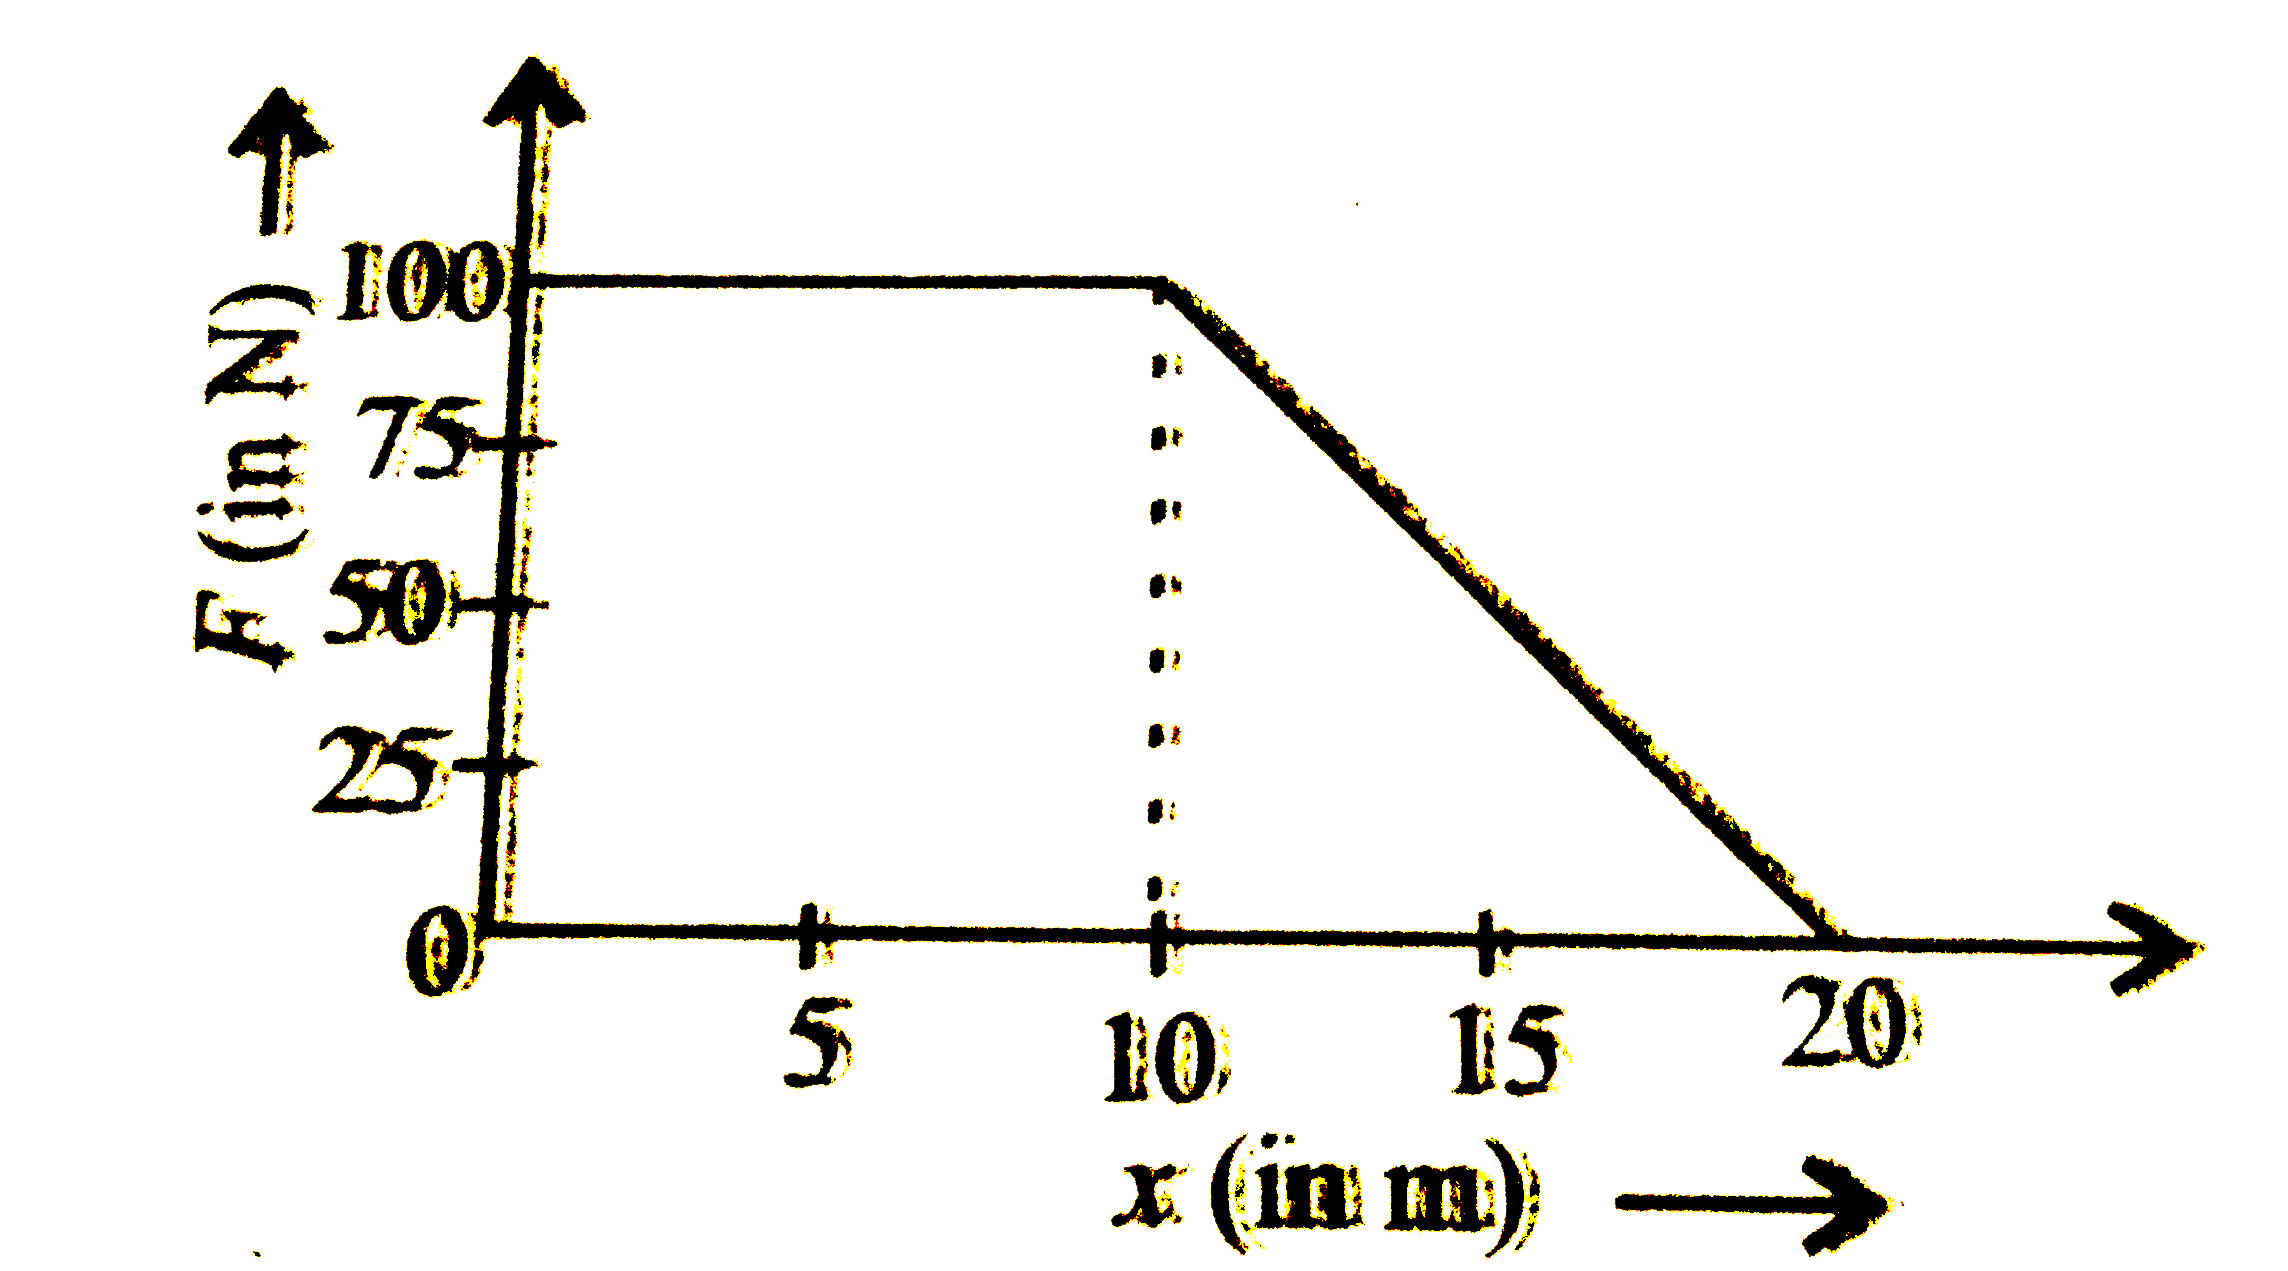 A500 JB1000 JC1500 JD2000 J
The current (I) in the inductance is varying with time according to the plot shown in figure.
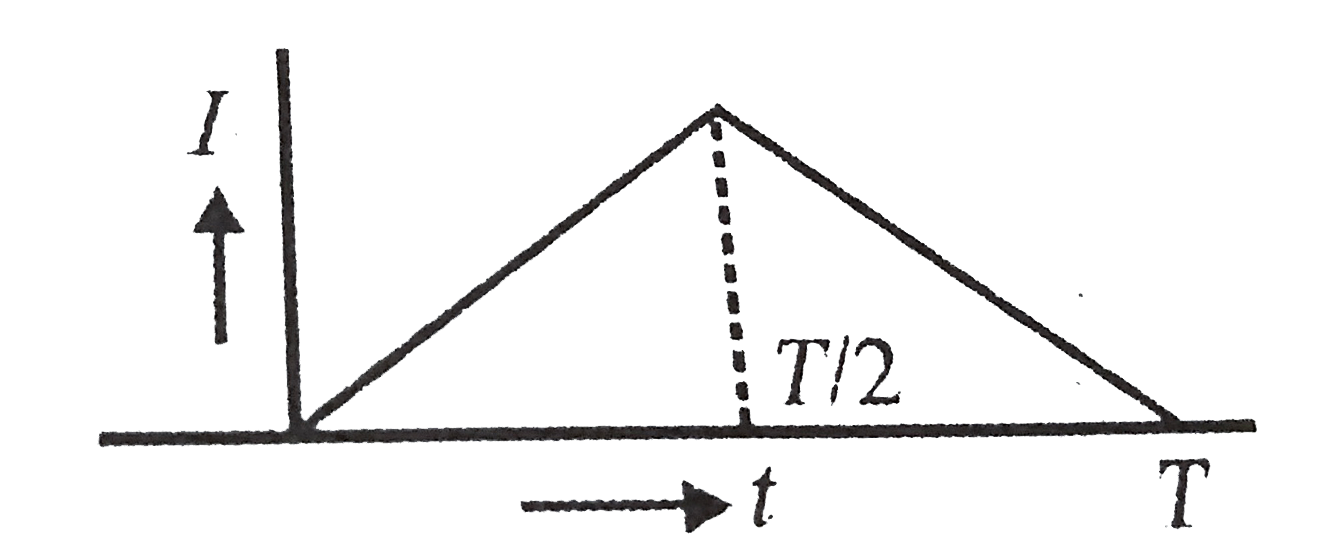
Which one of the following is the correct variation of voltage with time in the coil?
View SolutionStatement A : If the force varies with time in a complicated way then the average force is measured by the total change in momentum of the body
Statement B : Change in momentum and impulsive force are numerically equal
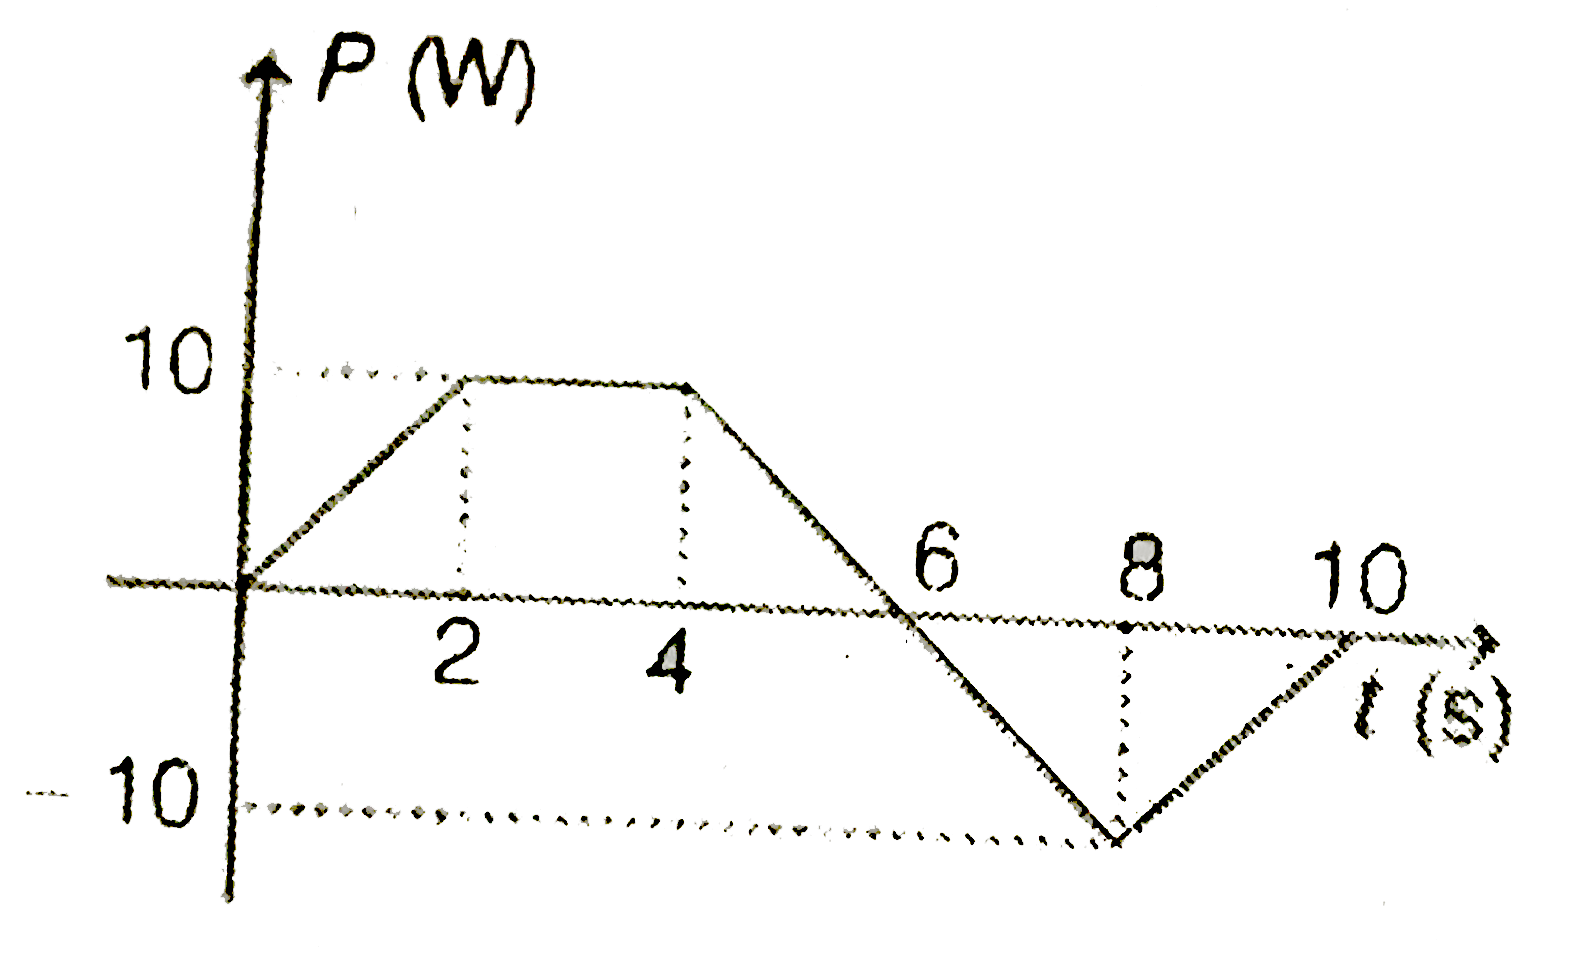
View SolutionPower of a force acting on a block varies with time t as shown in figure. Then, angle between force acting on the block and its velocity is
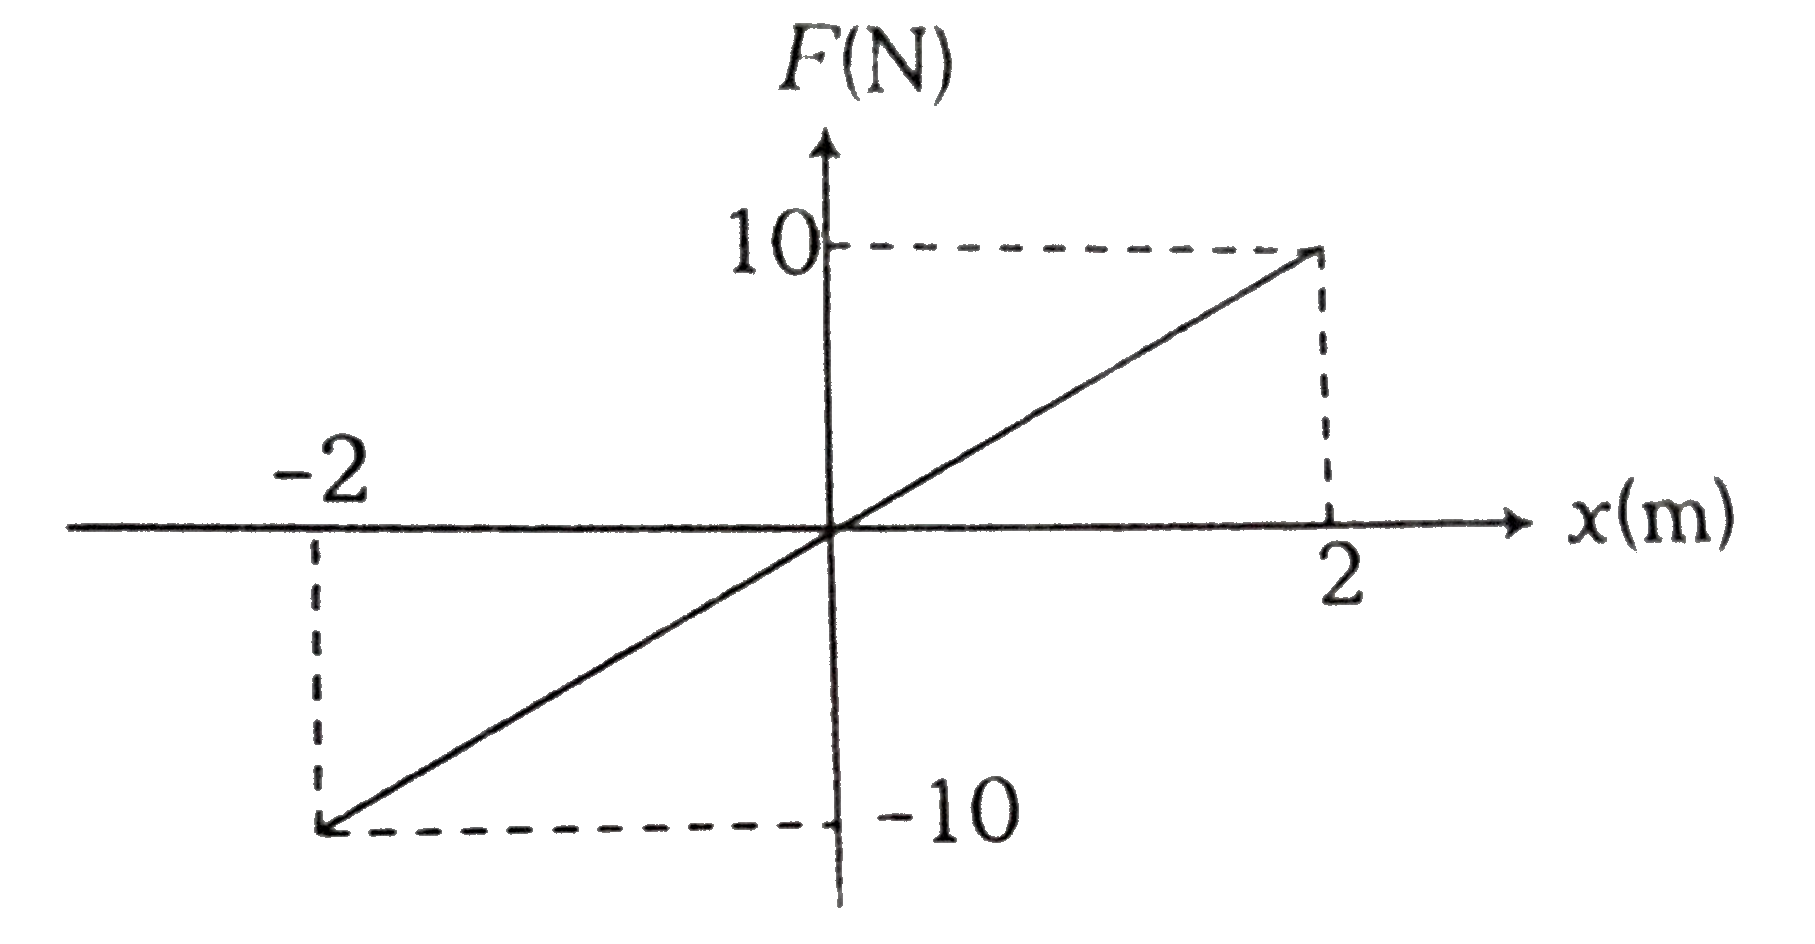
View SolutionA force F acting on a particle varies with the position x as shown in figure. Find the work done by this force in displacing the particle from
View SolutionA unidirectional force F varying with time t as shown in the figure acts for a short duration 2T on a particle which is initially at rest. Then the velocity acquired by the body is:
View SolutionThe current I in an inductance coil varies with time according to the graph given in the figure.
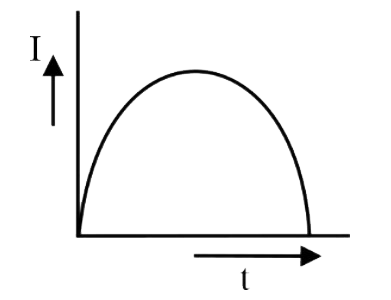
Which one of the following graphs gives the variation of voltage with time across the inductor?
View Solution
