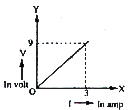
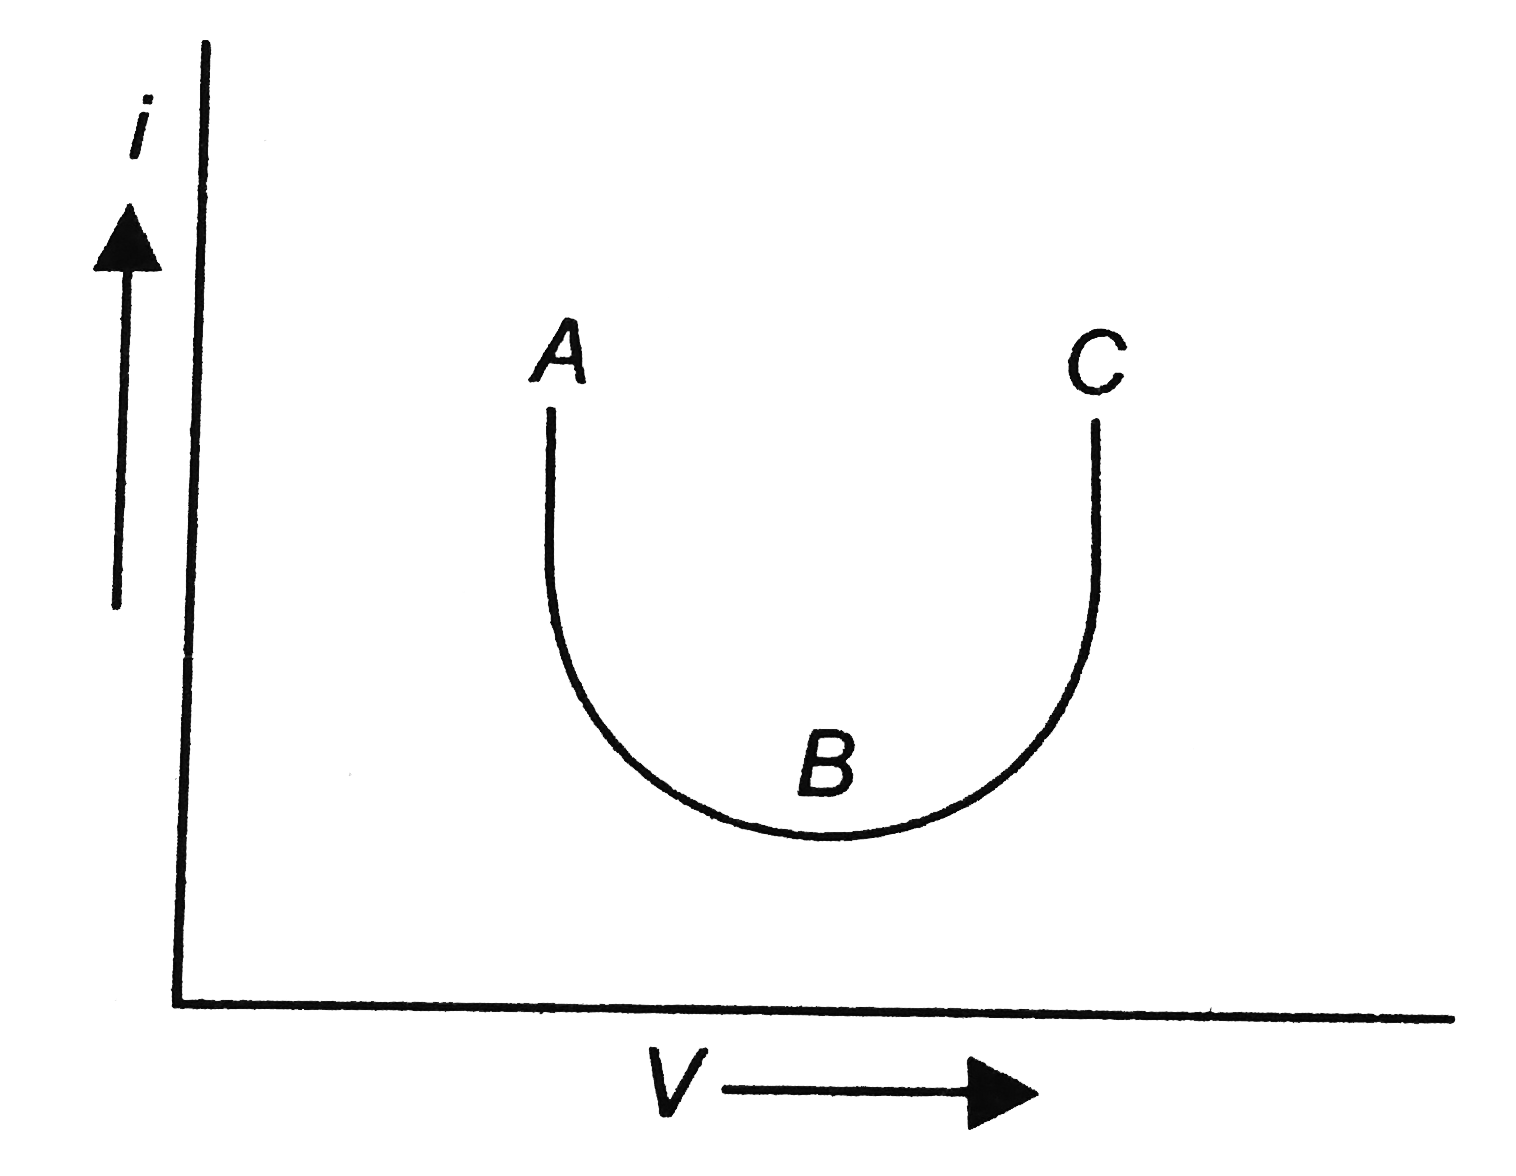
The variation of current and voltage in a conductor has been shown in figure. The resistance of the conductor is
4Ω
2Ω
3Ω
1Ω
The correct Answer is:C
Step by step video & image solution for The variation of current and voltage in a conductor has been shown in figure. The resistance of the conductor is by Physics experts to help you in doubts & scoring excellent marks in Class 12 exams.
Updated on:21/07/2023Topper's Solved these Questions
- APPENDICES ( REVISION EXERCISE )BOOK - AAKASH SERIESCHAPTER - APPENDICES ( REVISION EXERCISE )EXERCISE - REVISION EXERCISE (MOVING CHANGES & MEGNETISM)
95 Videos
- APPENDICES ( REVISION EXERCISE )BOOK - AAKASH SERIESCHAPTER - APPENDICES ( REVISION EXERCISE )EXERCISE - REVISION EXERCISE (MAGNETISM AND MATTER )
52 Videos
- APPENDICES ( REVISION EXERCISE )BOOK - AAKASH SERIESCHAPTER - APPENDICES ( REVISION EXERCISE )EXERCISE - REVISION EXERCISE (ELECTRIC POTENTIAL & CAPACITANCE )
143 Videos
- ALTERNATING CURRENTBOOK - AAKASH SERIESCHAPTER - ALTERNATING CURRENTEXERCISE - EXERCISE - III
24 Videos
- APPENDICES (REVISION EXERCISE)BOOK - AAKASH SERIESCHAPTER - APPENDICES (REVISION EXERCISE)EXERCISE - LAW OF MOTION
128 Videos
Similar Questions
Relation between current in a conductor and time is shown in fig.
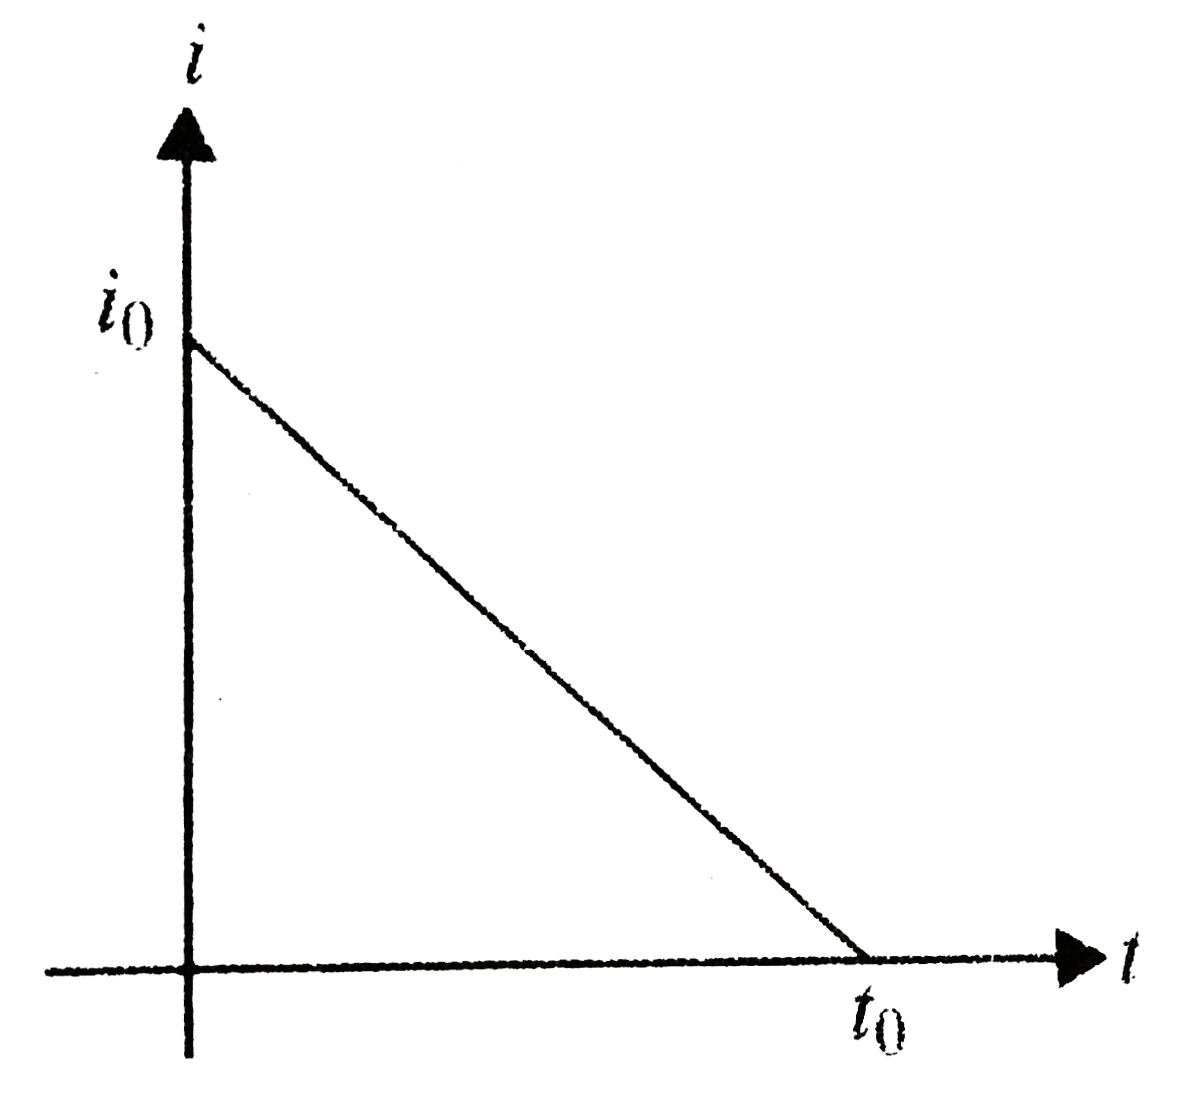
If the resistance of the conductor is R, then the total heat disspipated across resistance R is
View SolutionThe resistance of a conductor depends on its
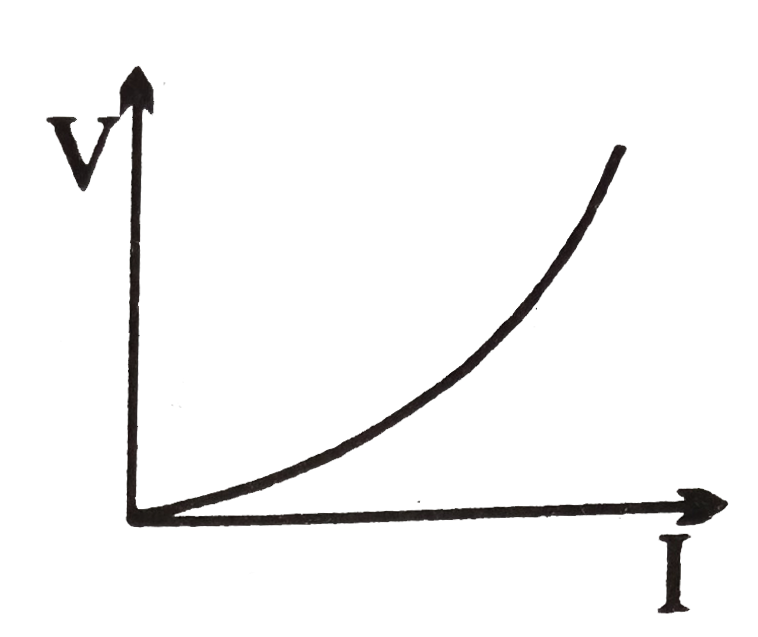
View SolutionThe variation of current (I) and voltage (V) is as shown in figure A. The variation of power P with current I is best shown by which of the following graph
View SolutionRelation between current in a conductor and time is shown in fig.
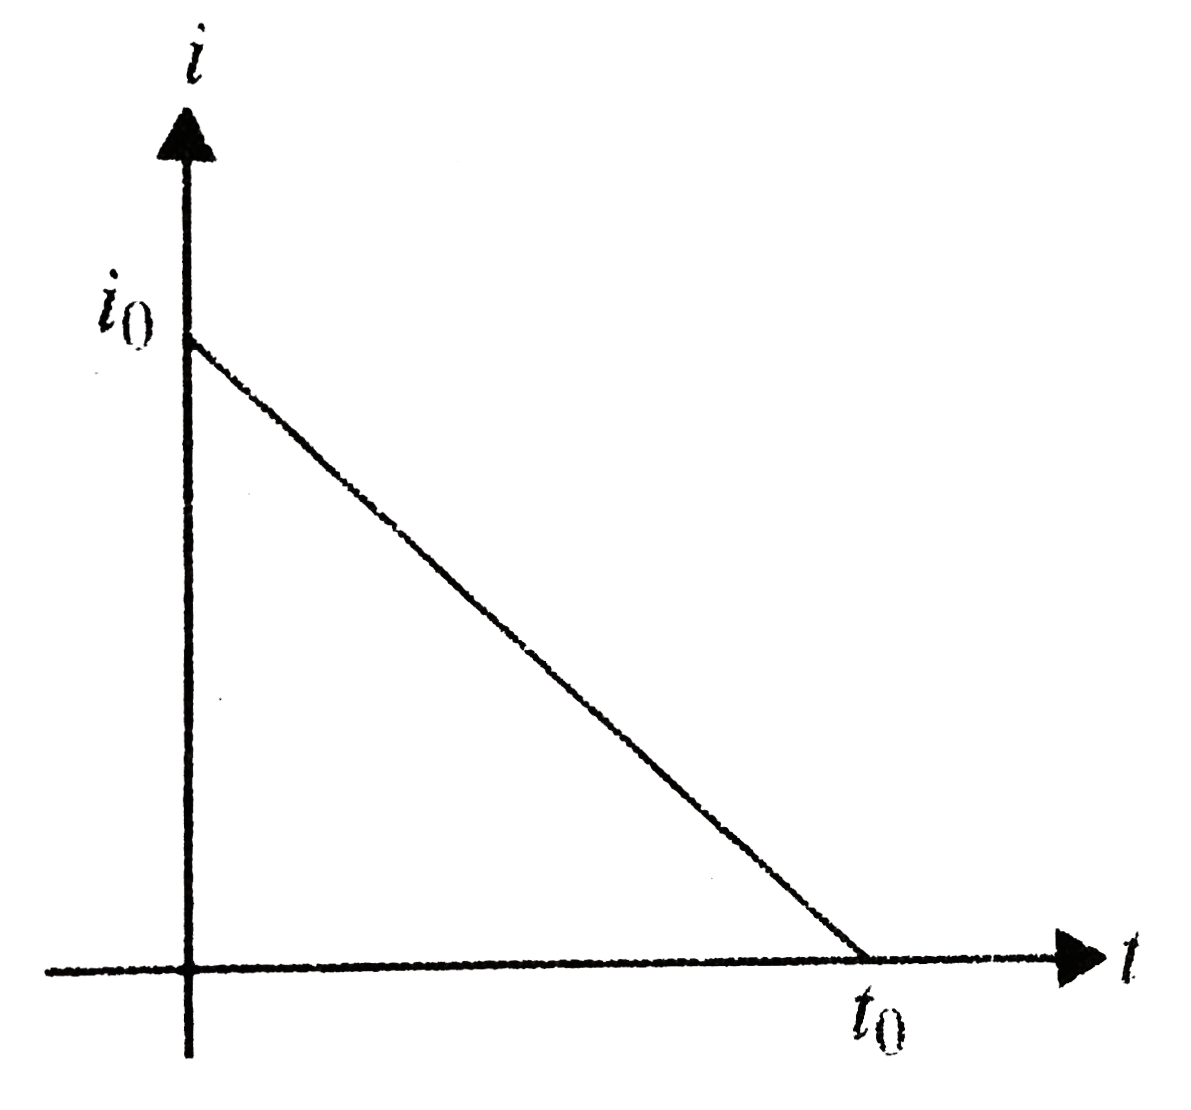
Total charge flowing through the conductor is
View SolutionThe current-voltage graph of a device is shown in figure. The resistance is negative in region.
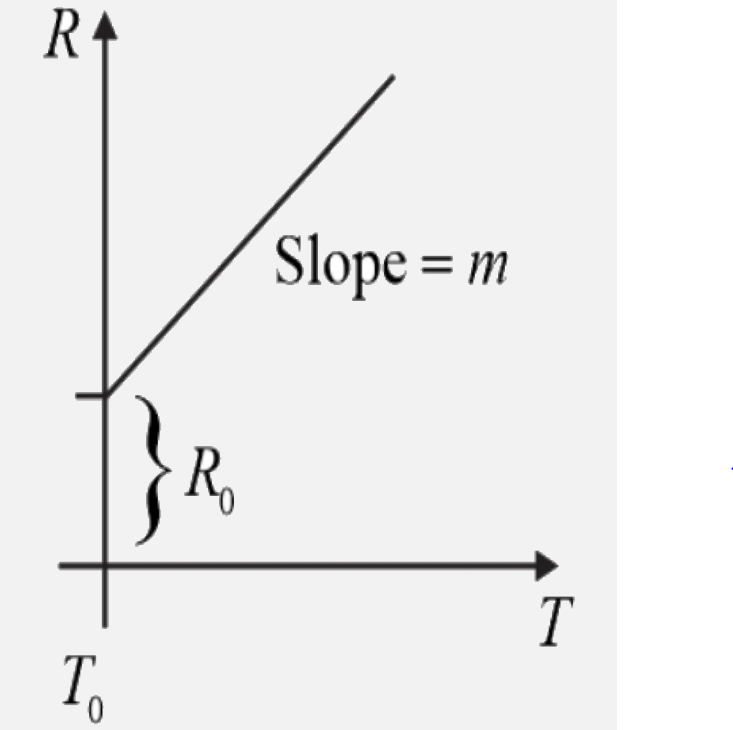
View SolutionVariation of resistance of the conductor with temperature is shown . Temperature coefficient of the conductor is
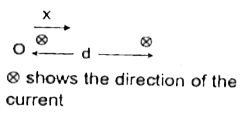
View SolutionWhich graph approximately shows the plot of magnetic field (B) with x between two current carrying conductors (as shown in the adjacent figure) if one of the conductors is at origin and they are separated by a distance d.
View SolutionState the factors affecting the resistance of a conductor.
View SolutionFor a given metallic conductor , the variation of current through the conductor with potential difference applied across the conductor is shown in the given graph. If temperature of the conductor is increased , then slope tan theta
_PHY_E01_0010_Q01.png)
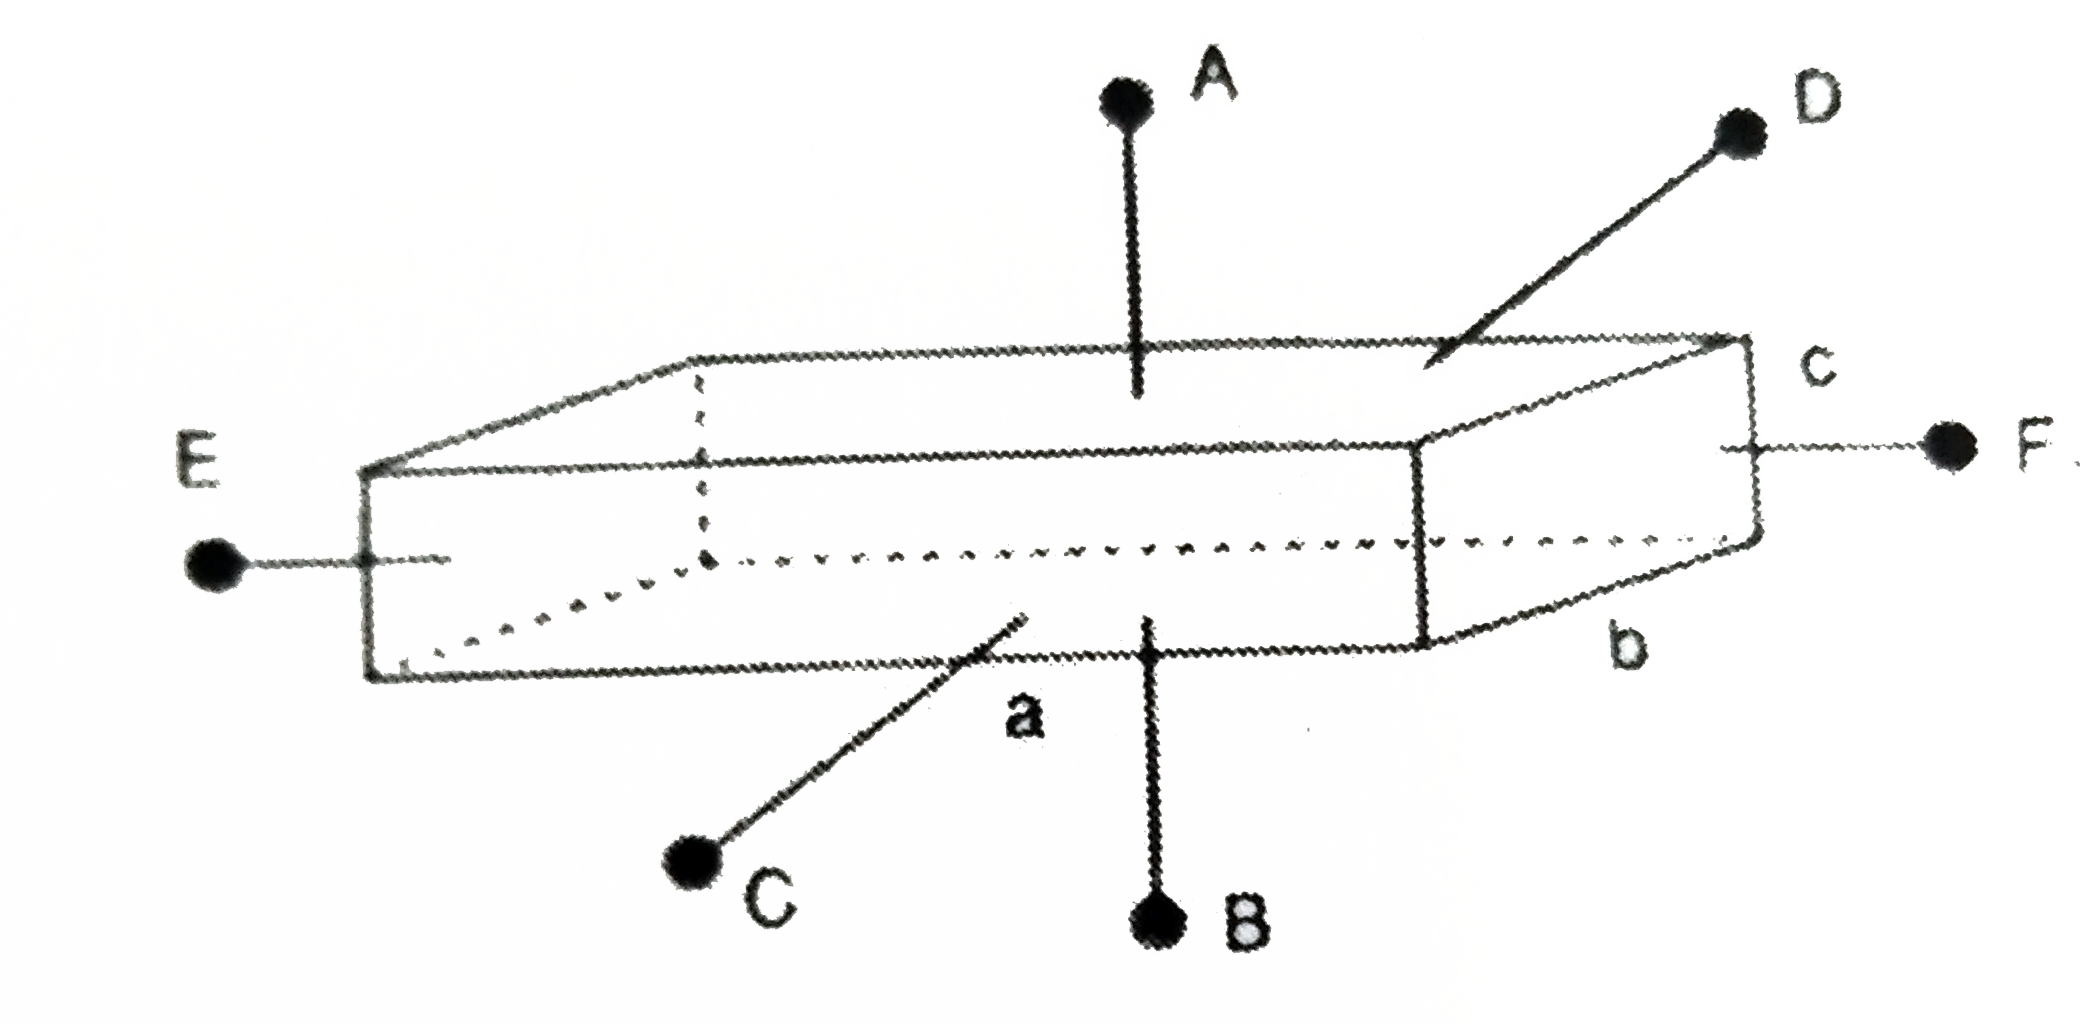
View SolutionThe dimensions of a conductor of specific resistance p are shown. Find the resistance of the conductor across AB, CD and EF.
View Solution
