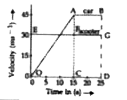
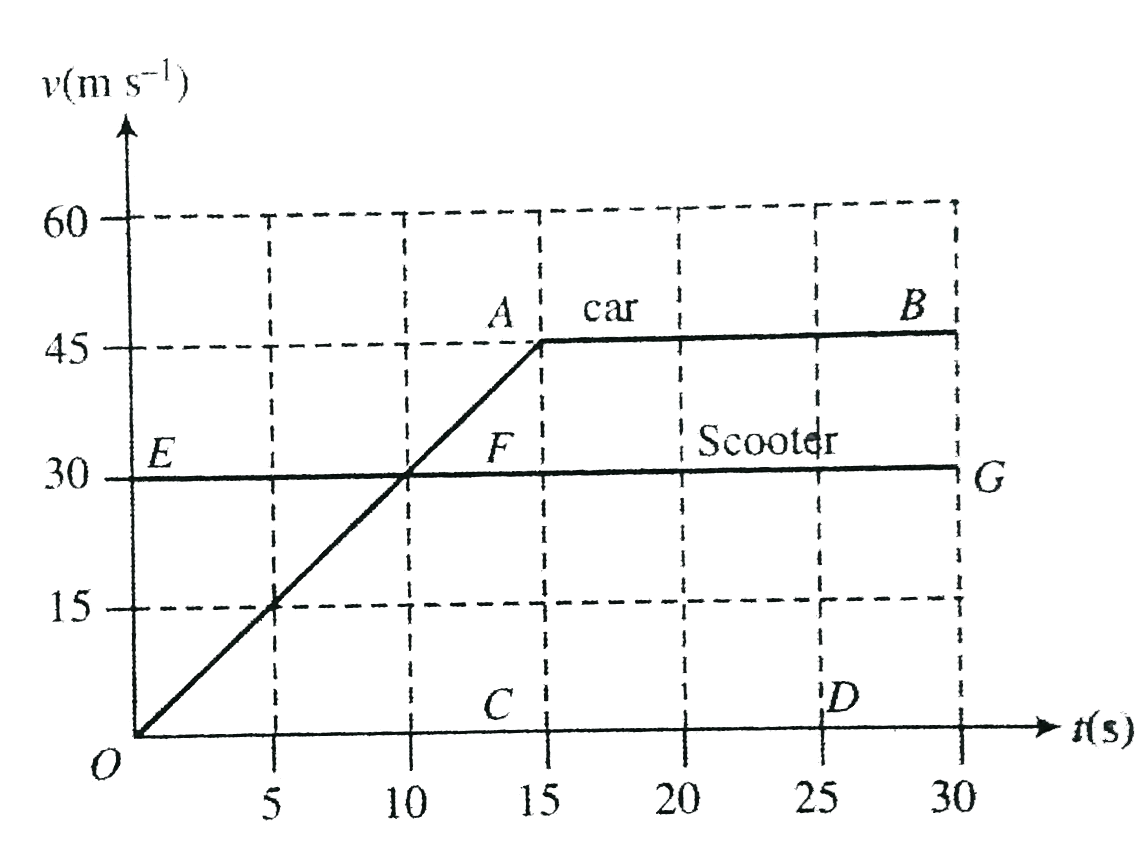
The velocity-time graphs of a car and a scooter are shown in the figure. (i) The difference between the distance travelled by the car and the scooter in 15 s and (ii) the time at which the car will catch up with the scooter are, respectively.
112.5mand22.5s
337.5mand25s
112.5mand15s
225.5mand10s
The correct Answer is:A
Step by step video solution for The velocity-time graphs of a car and a scooter are shown in the figure. (i) The difference between the distance travelled by the car and the scooter in 15 s and (ii) the time at which the car will catch up with the scooter are, respectively. by Physics experts to help you in doubts & scoring excellent marks in Class 11 exams.
Updated on:21/07/2023Similar Questions
The velocity-time graphsof a car and a scooter are shown in the figure. (i) The difference between the distance travelled by the car and the scooter in 15 and (ii) the time at which the car will catch up with the scooter are, respectively.
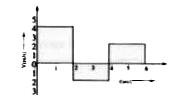
View SolutionThe velocity time graph of a body moving in a straight line is shown in the figure. The displacement and distance travelled by the body in 6 sec are respectively.
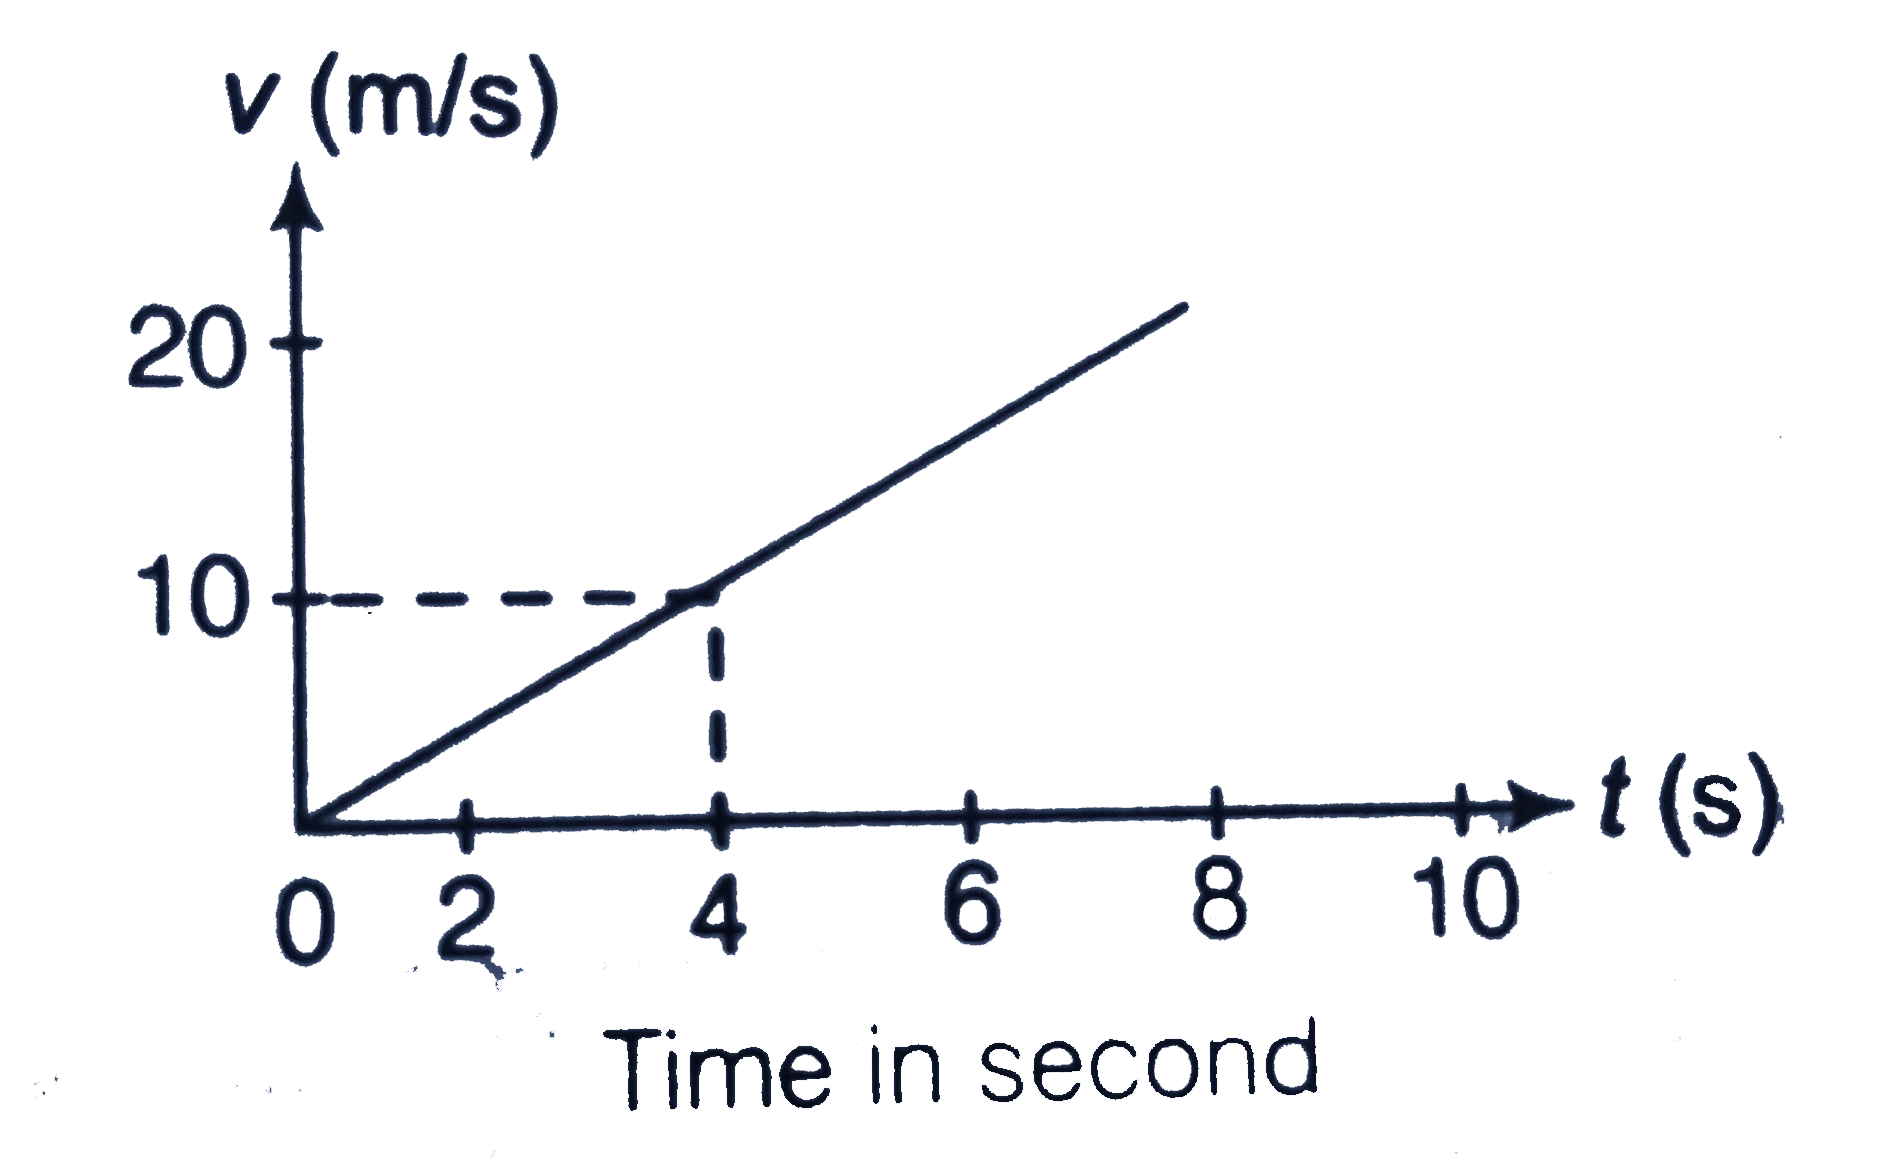
View SolutionThe speed of a car as a function of time is shown in figure.
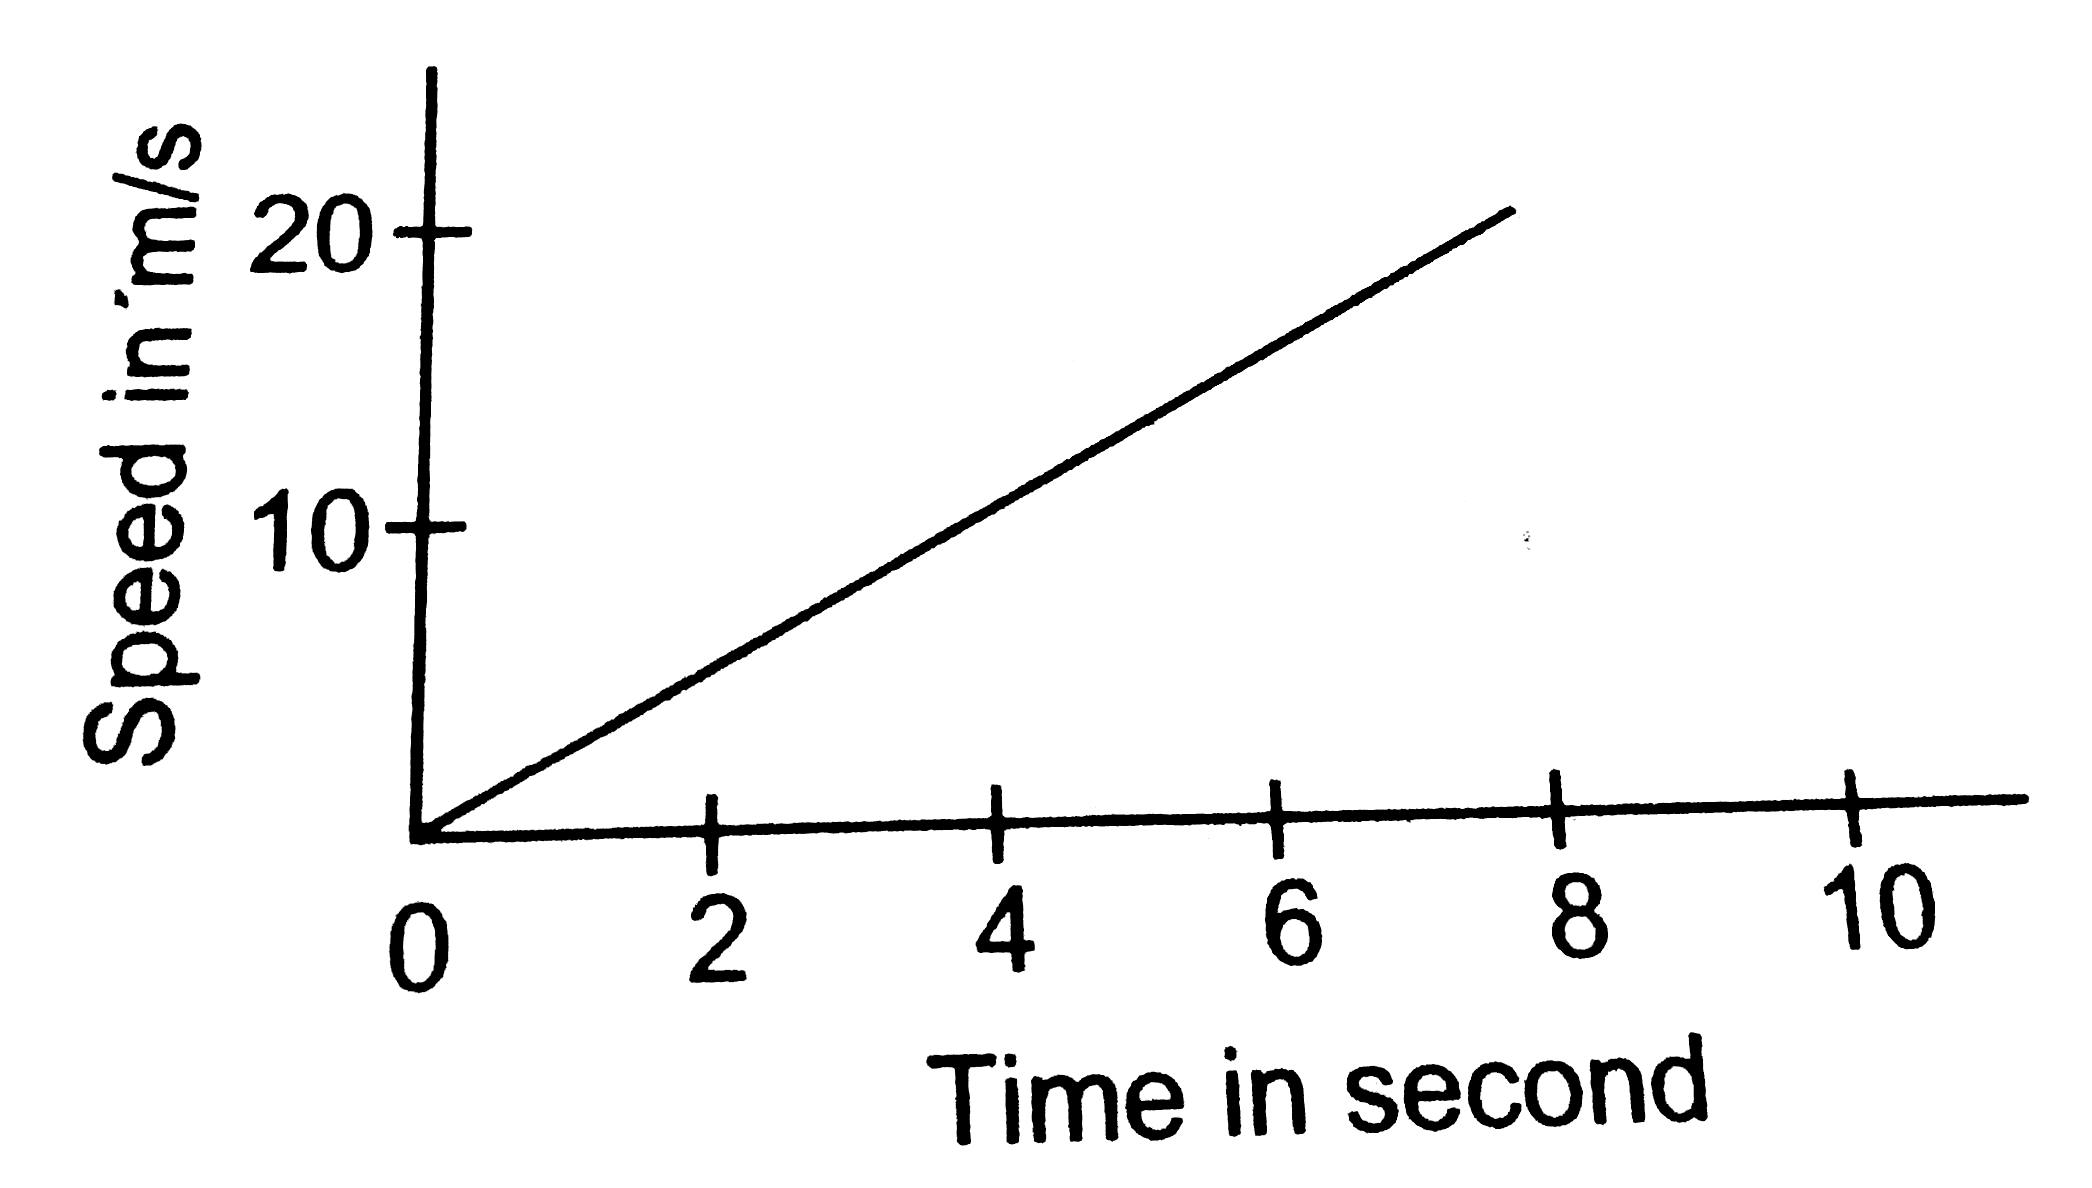
Find the distance travelled by the car in 8 seconds and its acceleration.
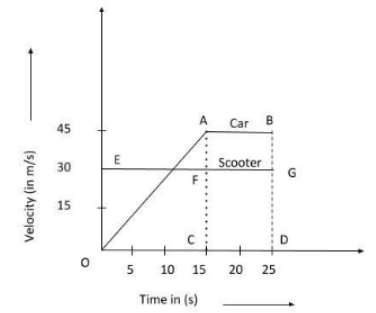
View SolutionAs soon as a car just starts from rest in a certain dercation, a scooter moveing with a uniform speed overtakes the car. Their velocity-time graph is shown in . Calculate
 .
.
a. The difference between the distances travlled by the car and the scooter in 15s,
b. The distance of car and scooter from the starting point at that instant.
View SolutionThe velocity of a car as a function of time is shown in Fig. Find the distance travelled by the car in 8s and its acceleration.
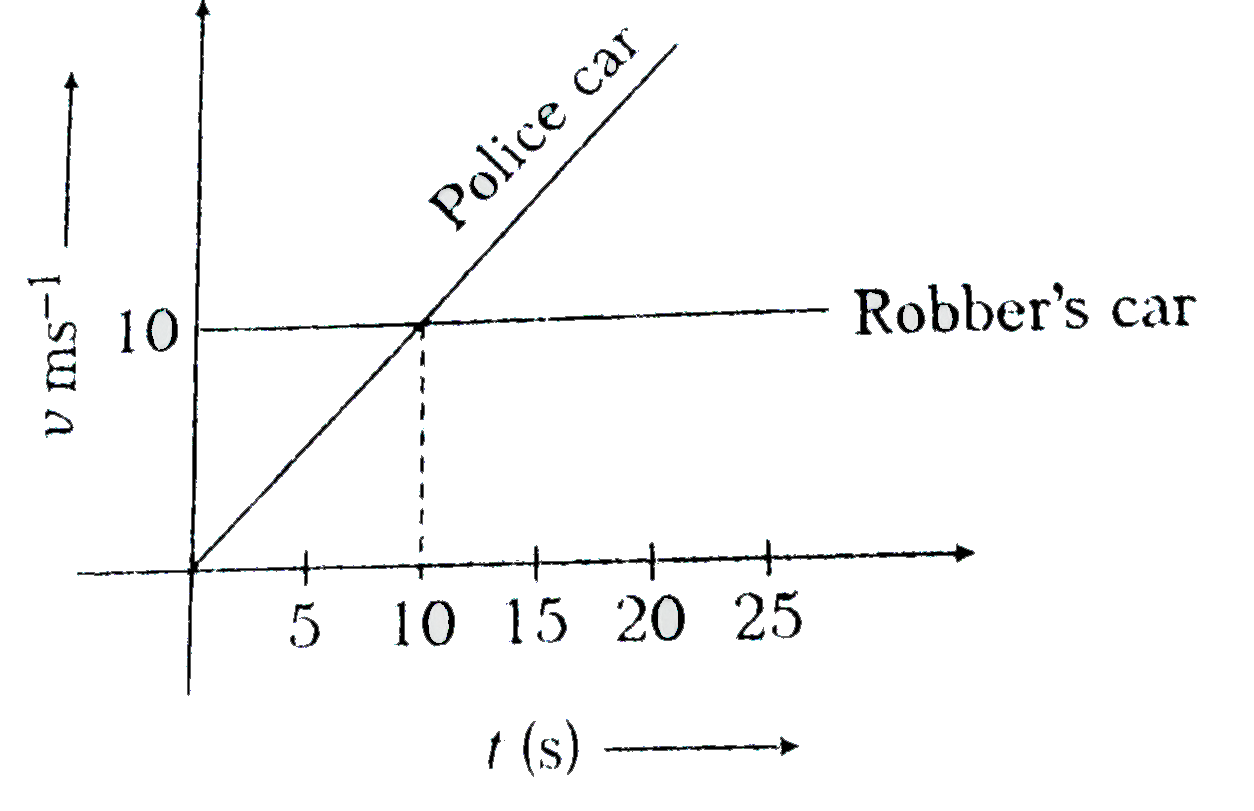
View SolutionThe velocity-time graph of robber's car and a chasing police car are shown in the following graph. Police car crosses the robber's car in time
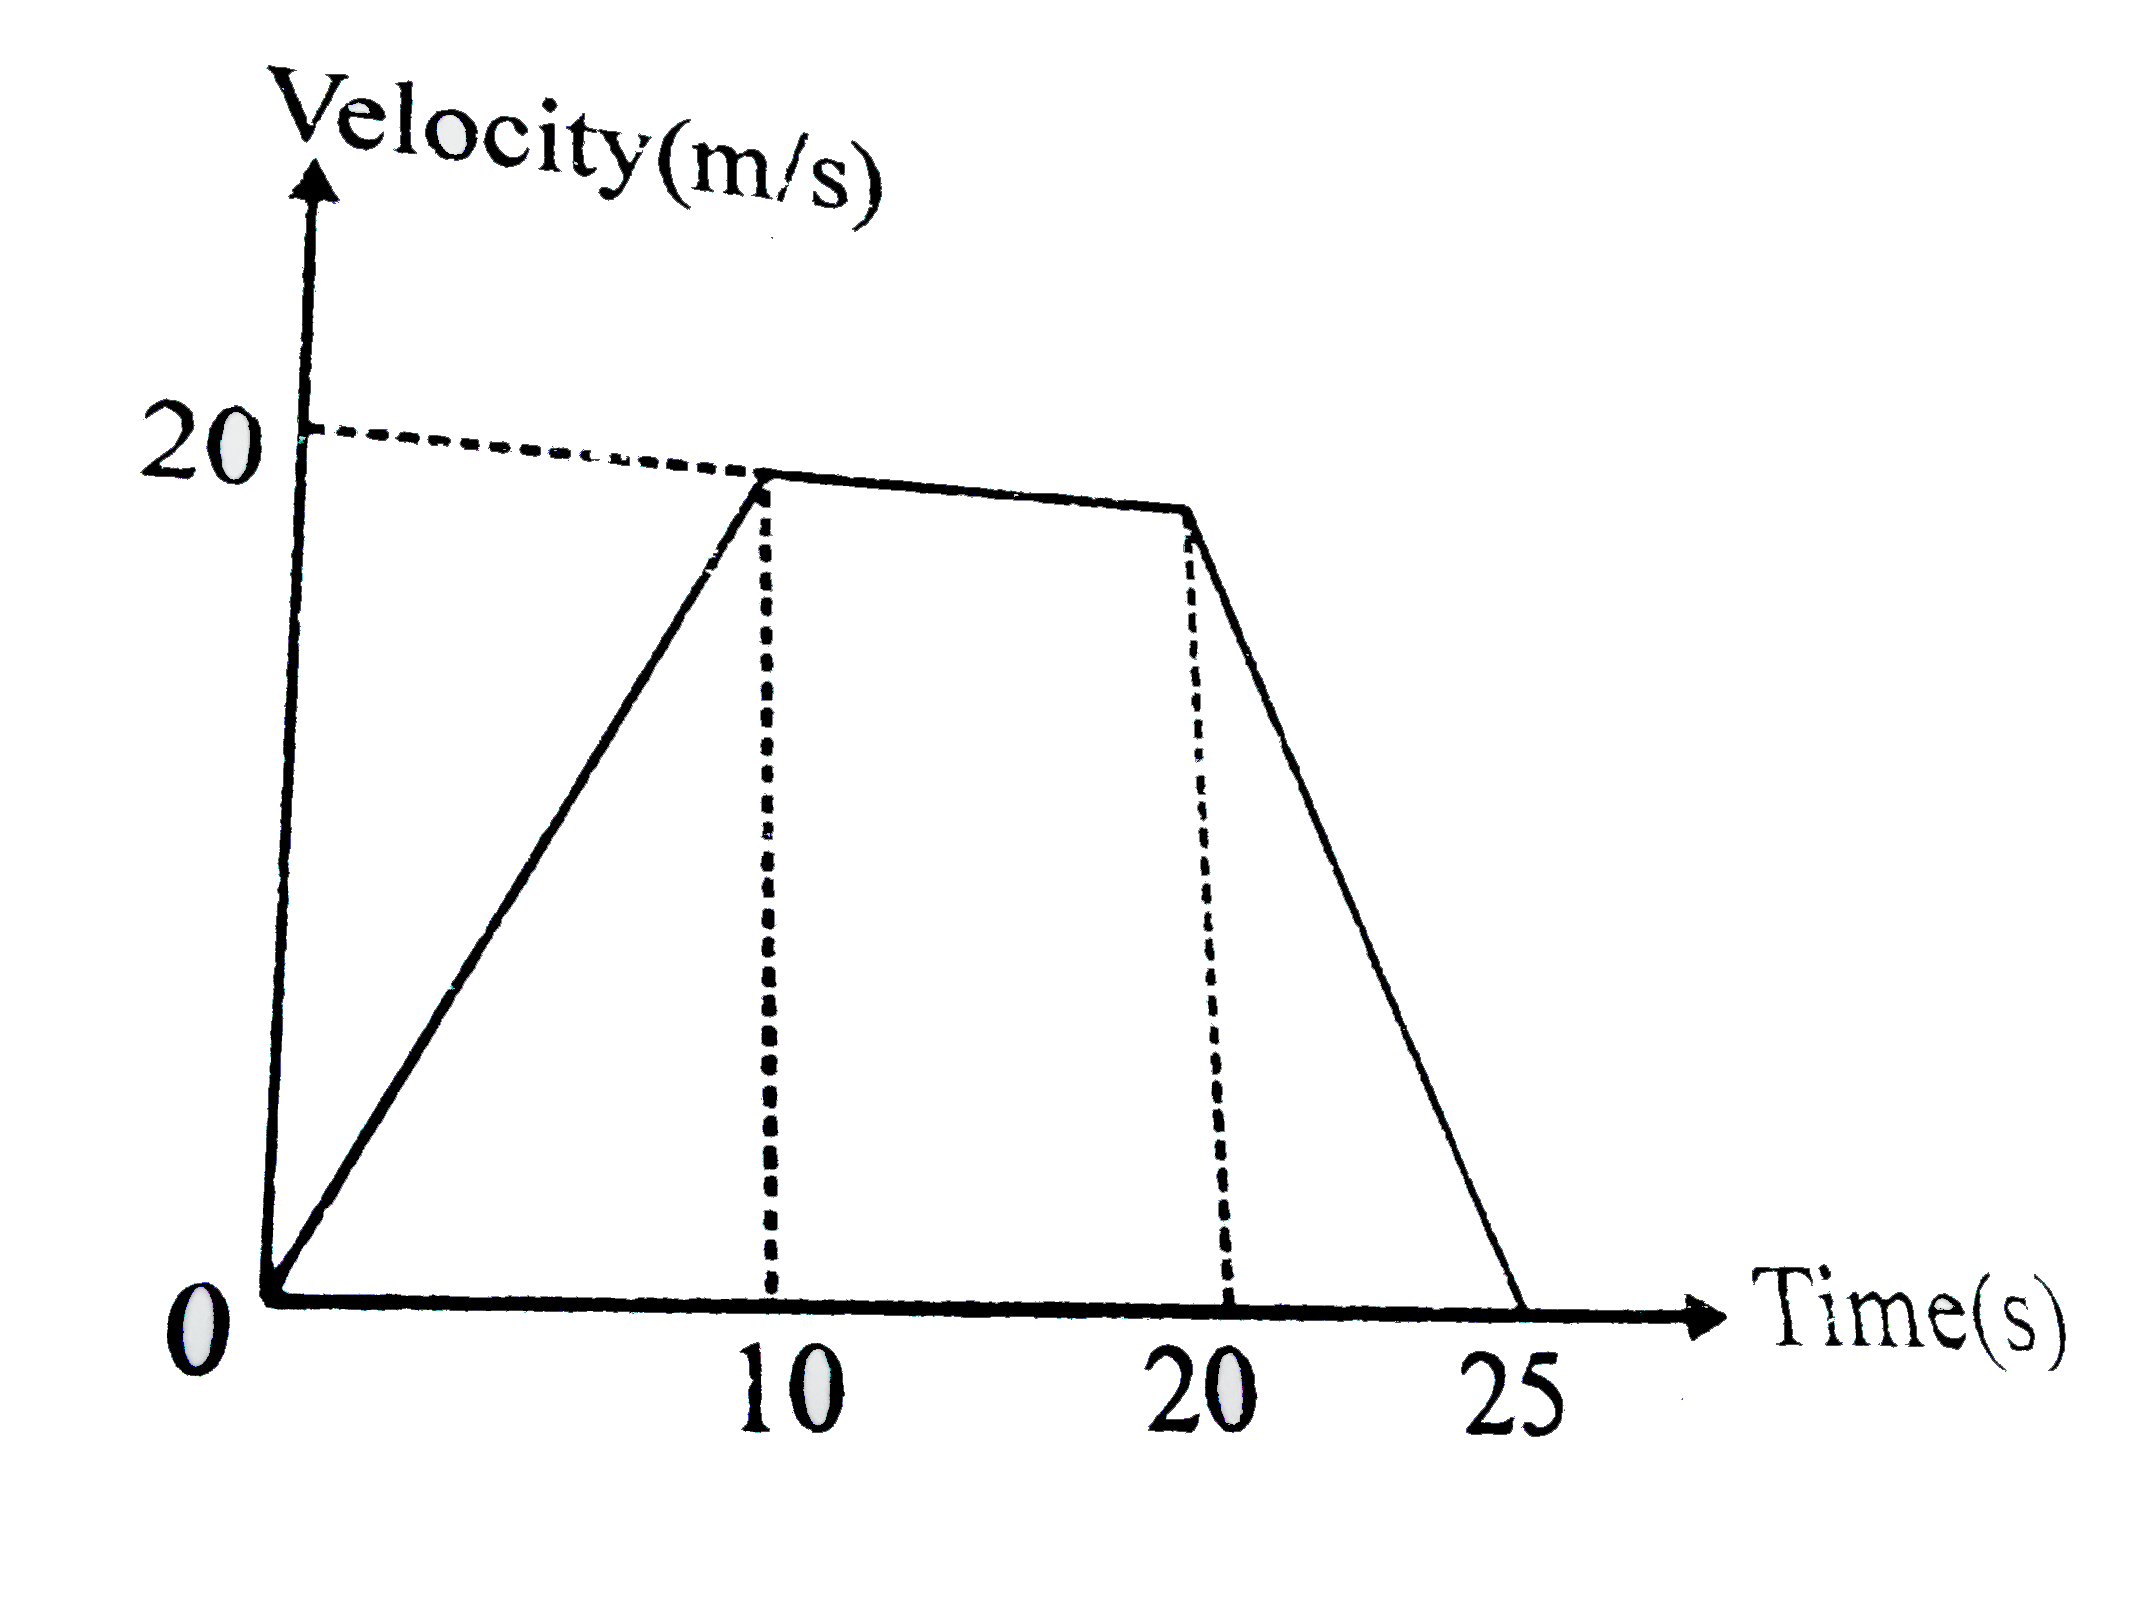
View SolutionThe velocity-time graph of a car moving along a straight road is shown in figure. The average velocity of the car is first 25 seconds is
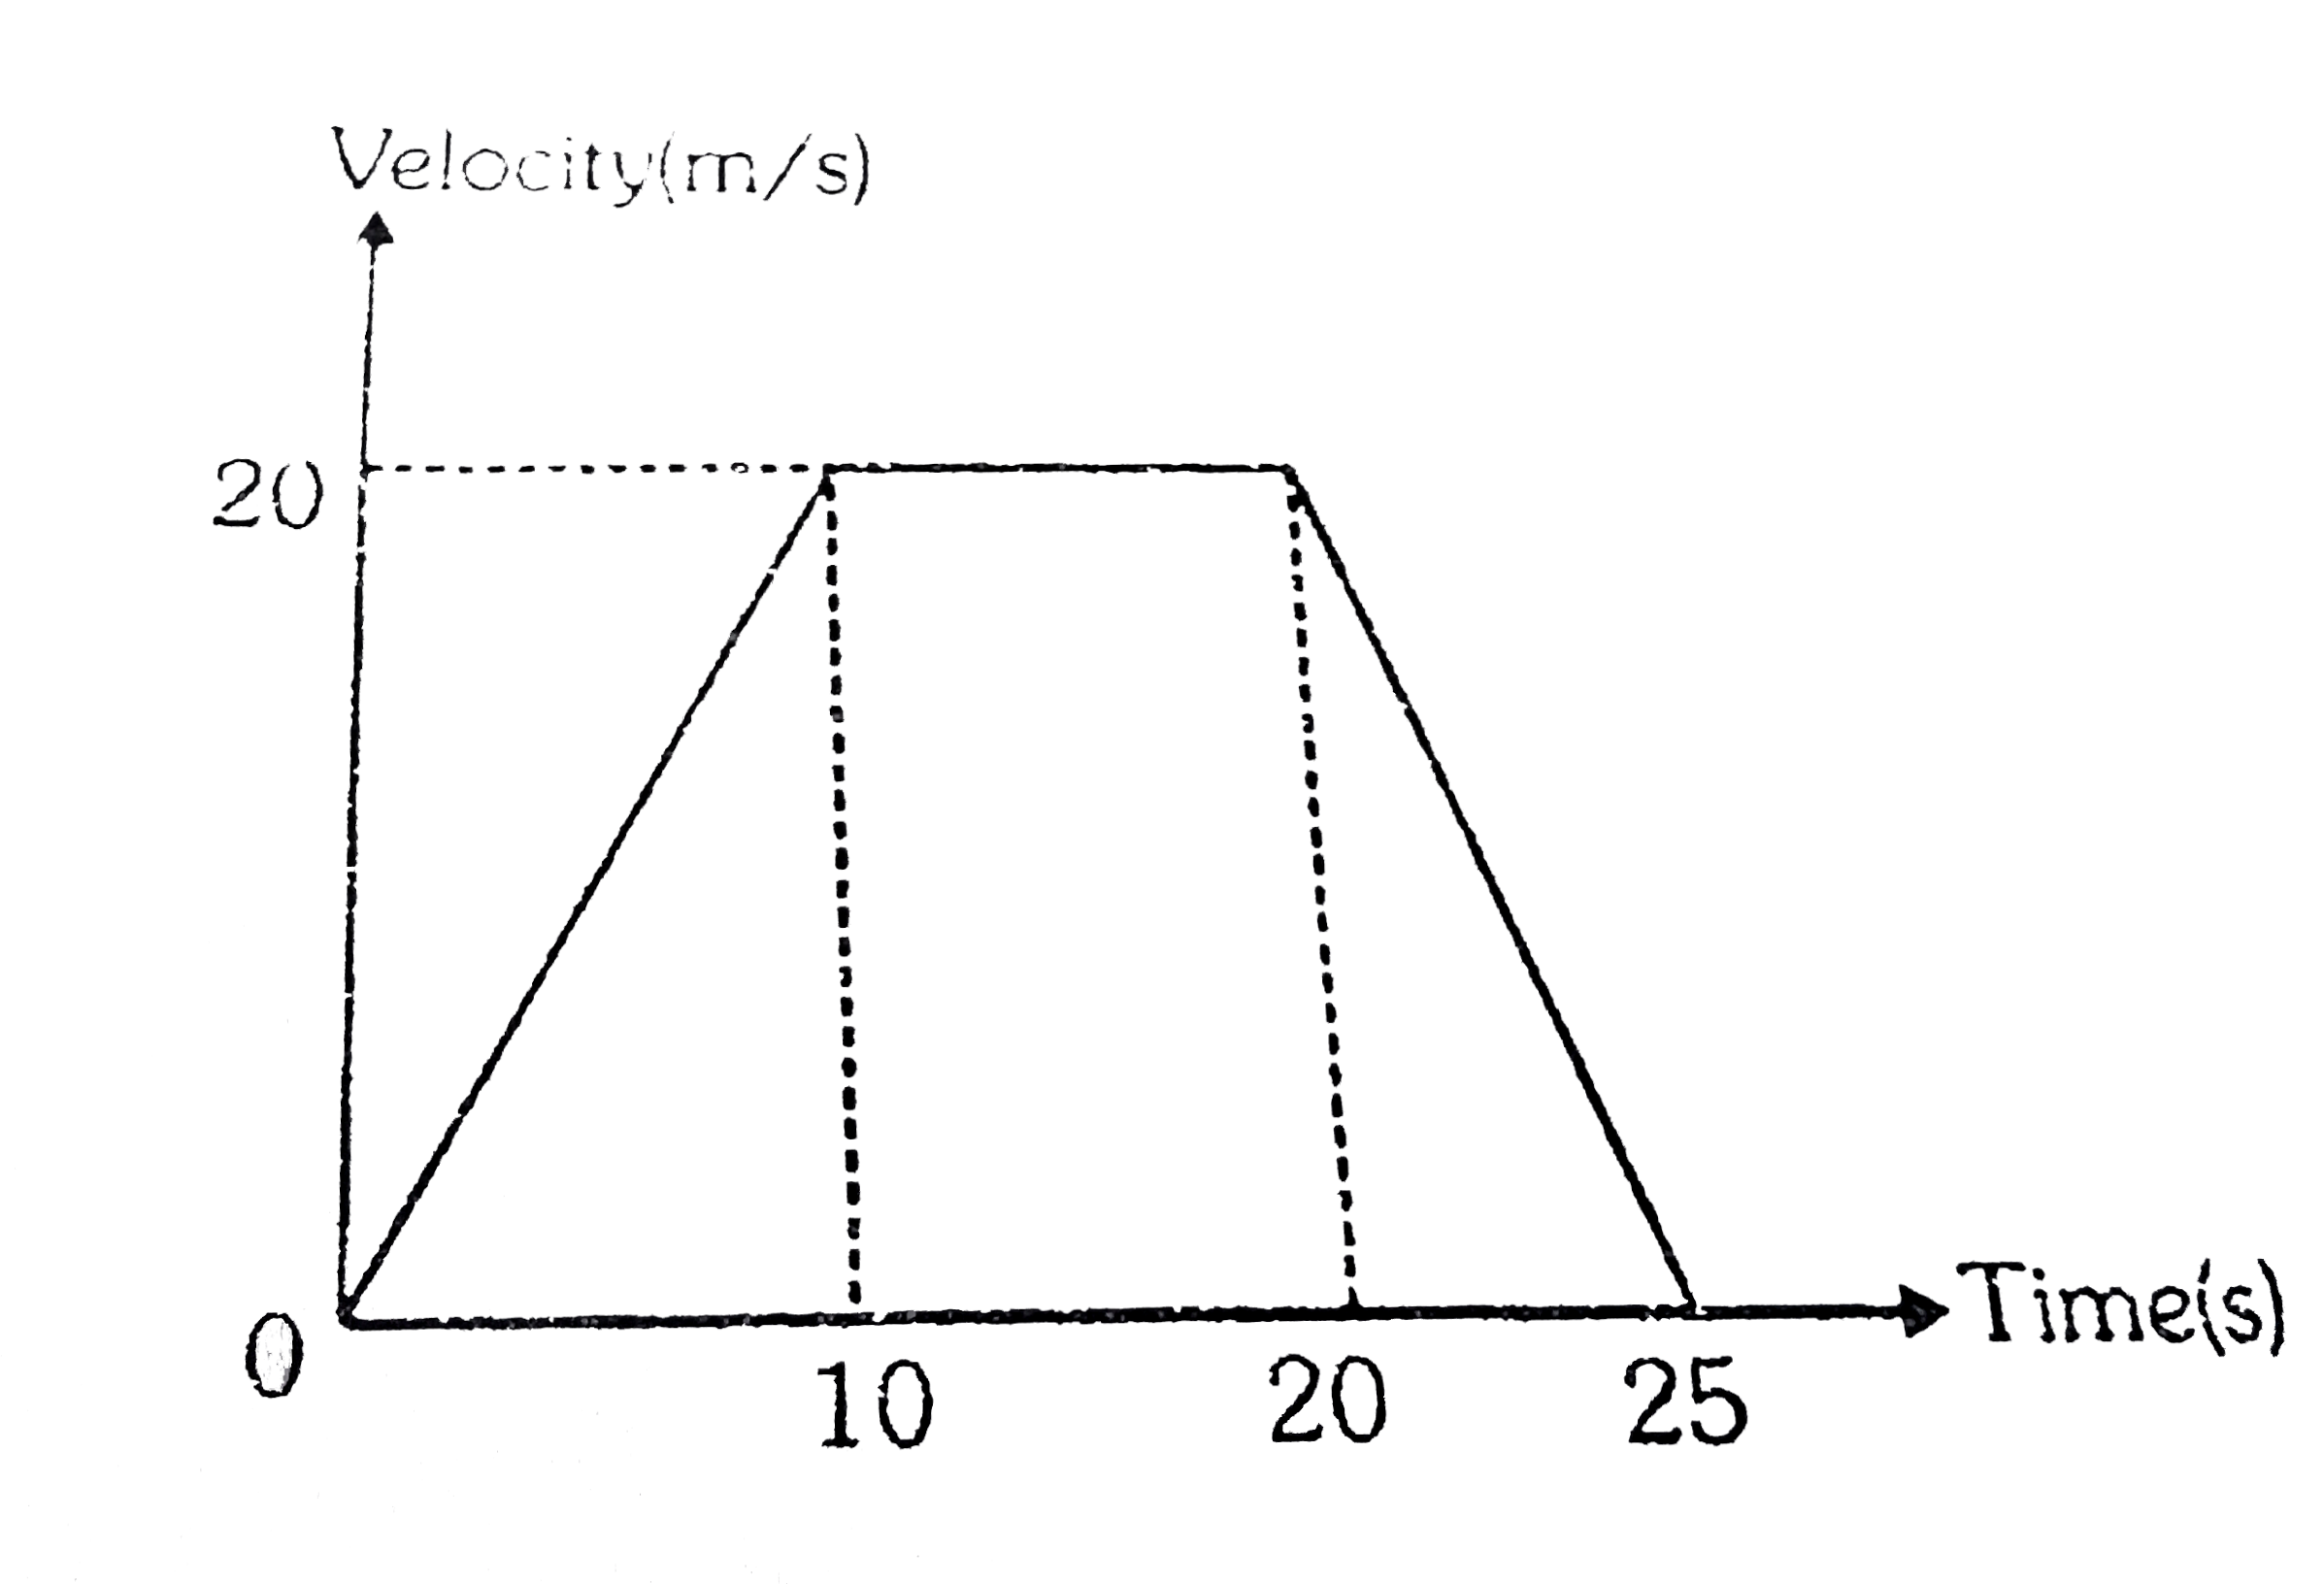
View SolutionThe velocity-time graph of a car moving along a straight road is shown in figure. The average velocity of the car in first 25 seconds is
View SolutionWhat will be the closest distance between the cars and also find the time instant at which the distance will be closest? :
 The distance will be:
View SolutionThe speed-time graph for a car is shown is Figure
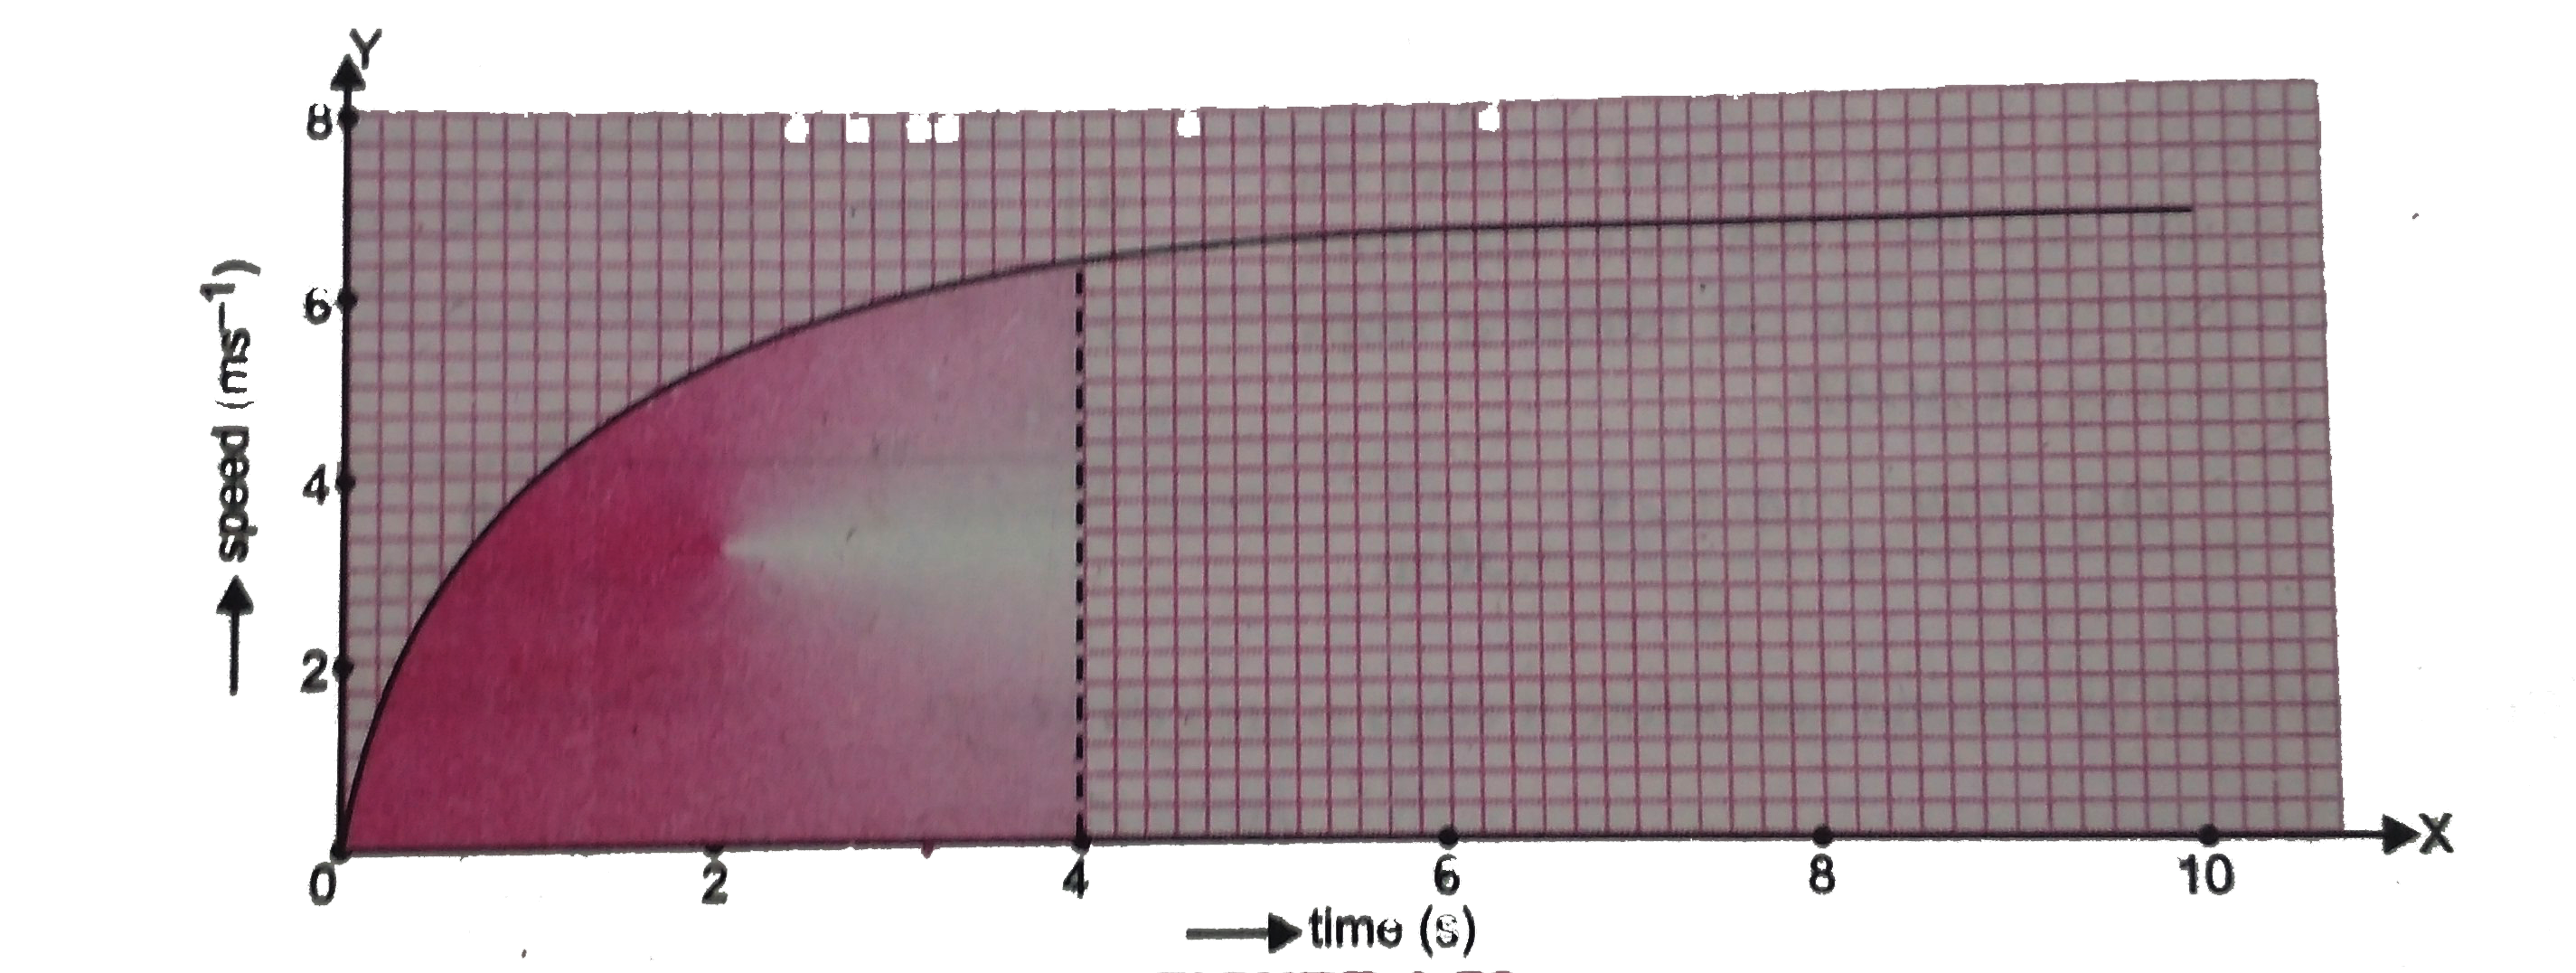
(a) Find how far does the car travel in the first 4 seconds. Shade the area on the graph that represents the distance travelled by the car during this period.
(b) Which part of the graph represents uniform motion of the car ?
View Solution
