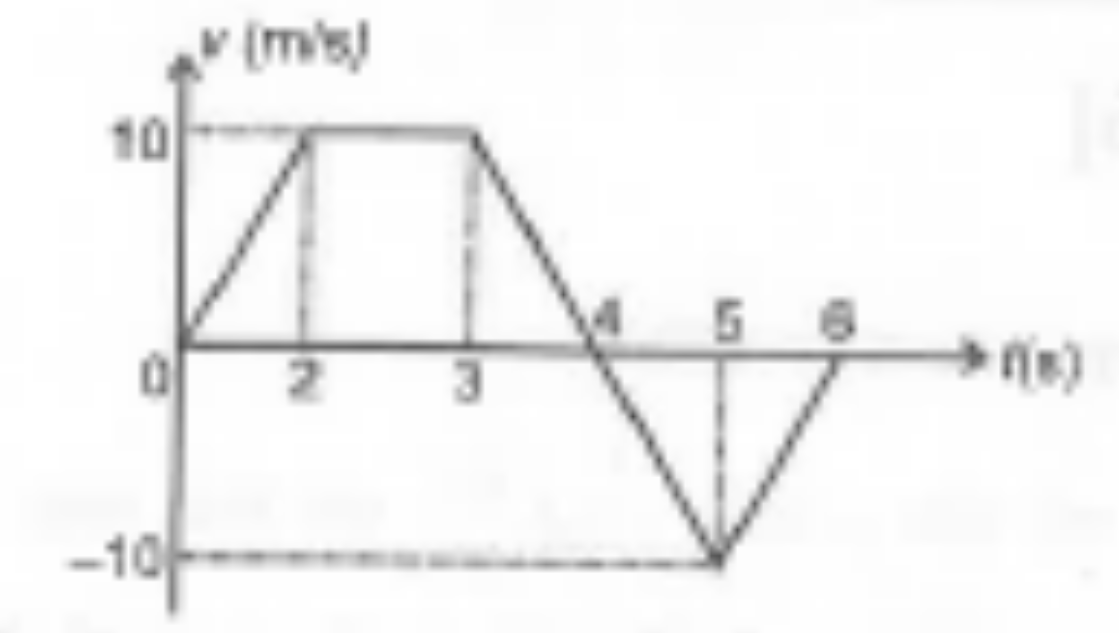
Velocity-time (v-t) graph for a moving object is shown in the figure. Total displacement of the object during the time interval when there is non-zero acceleration and retardation is

60m
50m
30m
40m
The correct Answer is:B
Step by step video solution for Velocity-time (v-t) graph for a moving object is shown in the figure. Total displacement of the object during the time interval when there is non-zero acceleration and retardation is by Physics experts to help you in doubts & scoring excellent marks in Class 11 exams.
Updated on:21/07/2023Similar Questions
Velocity -time (v-t) graph for a moving object is shown in the figure .Total displacement of the object during the time interval when there is non-zero acceleration and reatardation is
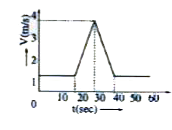
View SolutionVelocity-time graph for a moving object is shown in the figure. Total displacement of the object during the time interval when there is non-zero acceleration and retardation is.
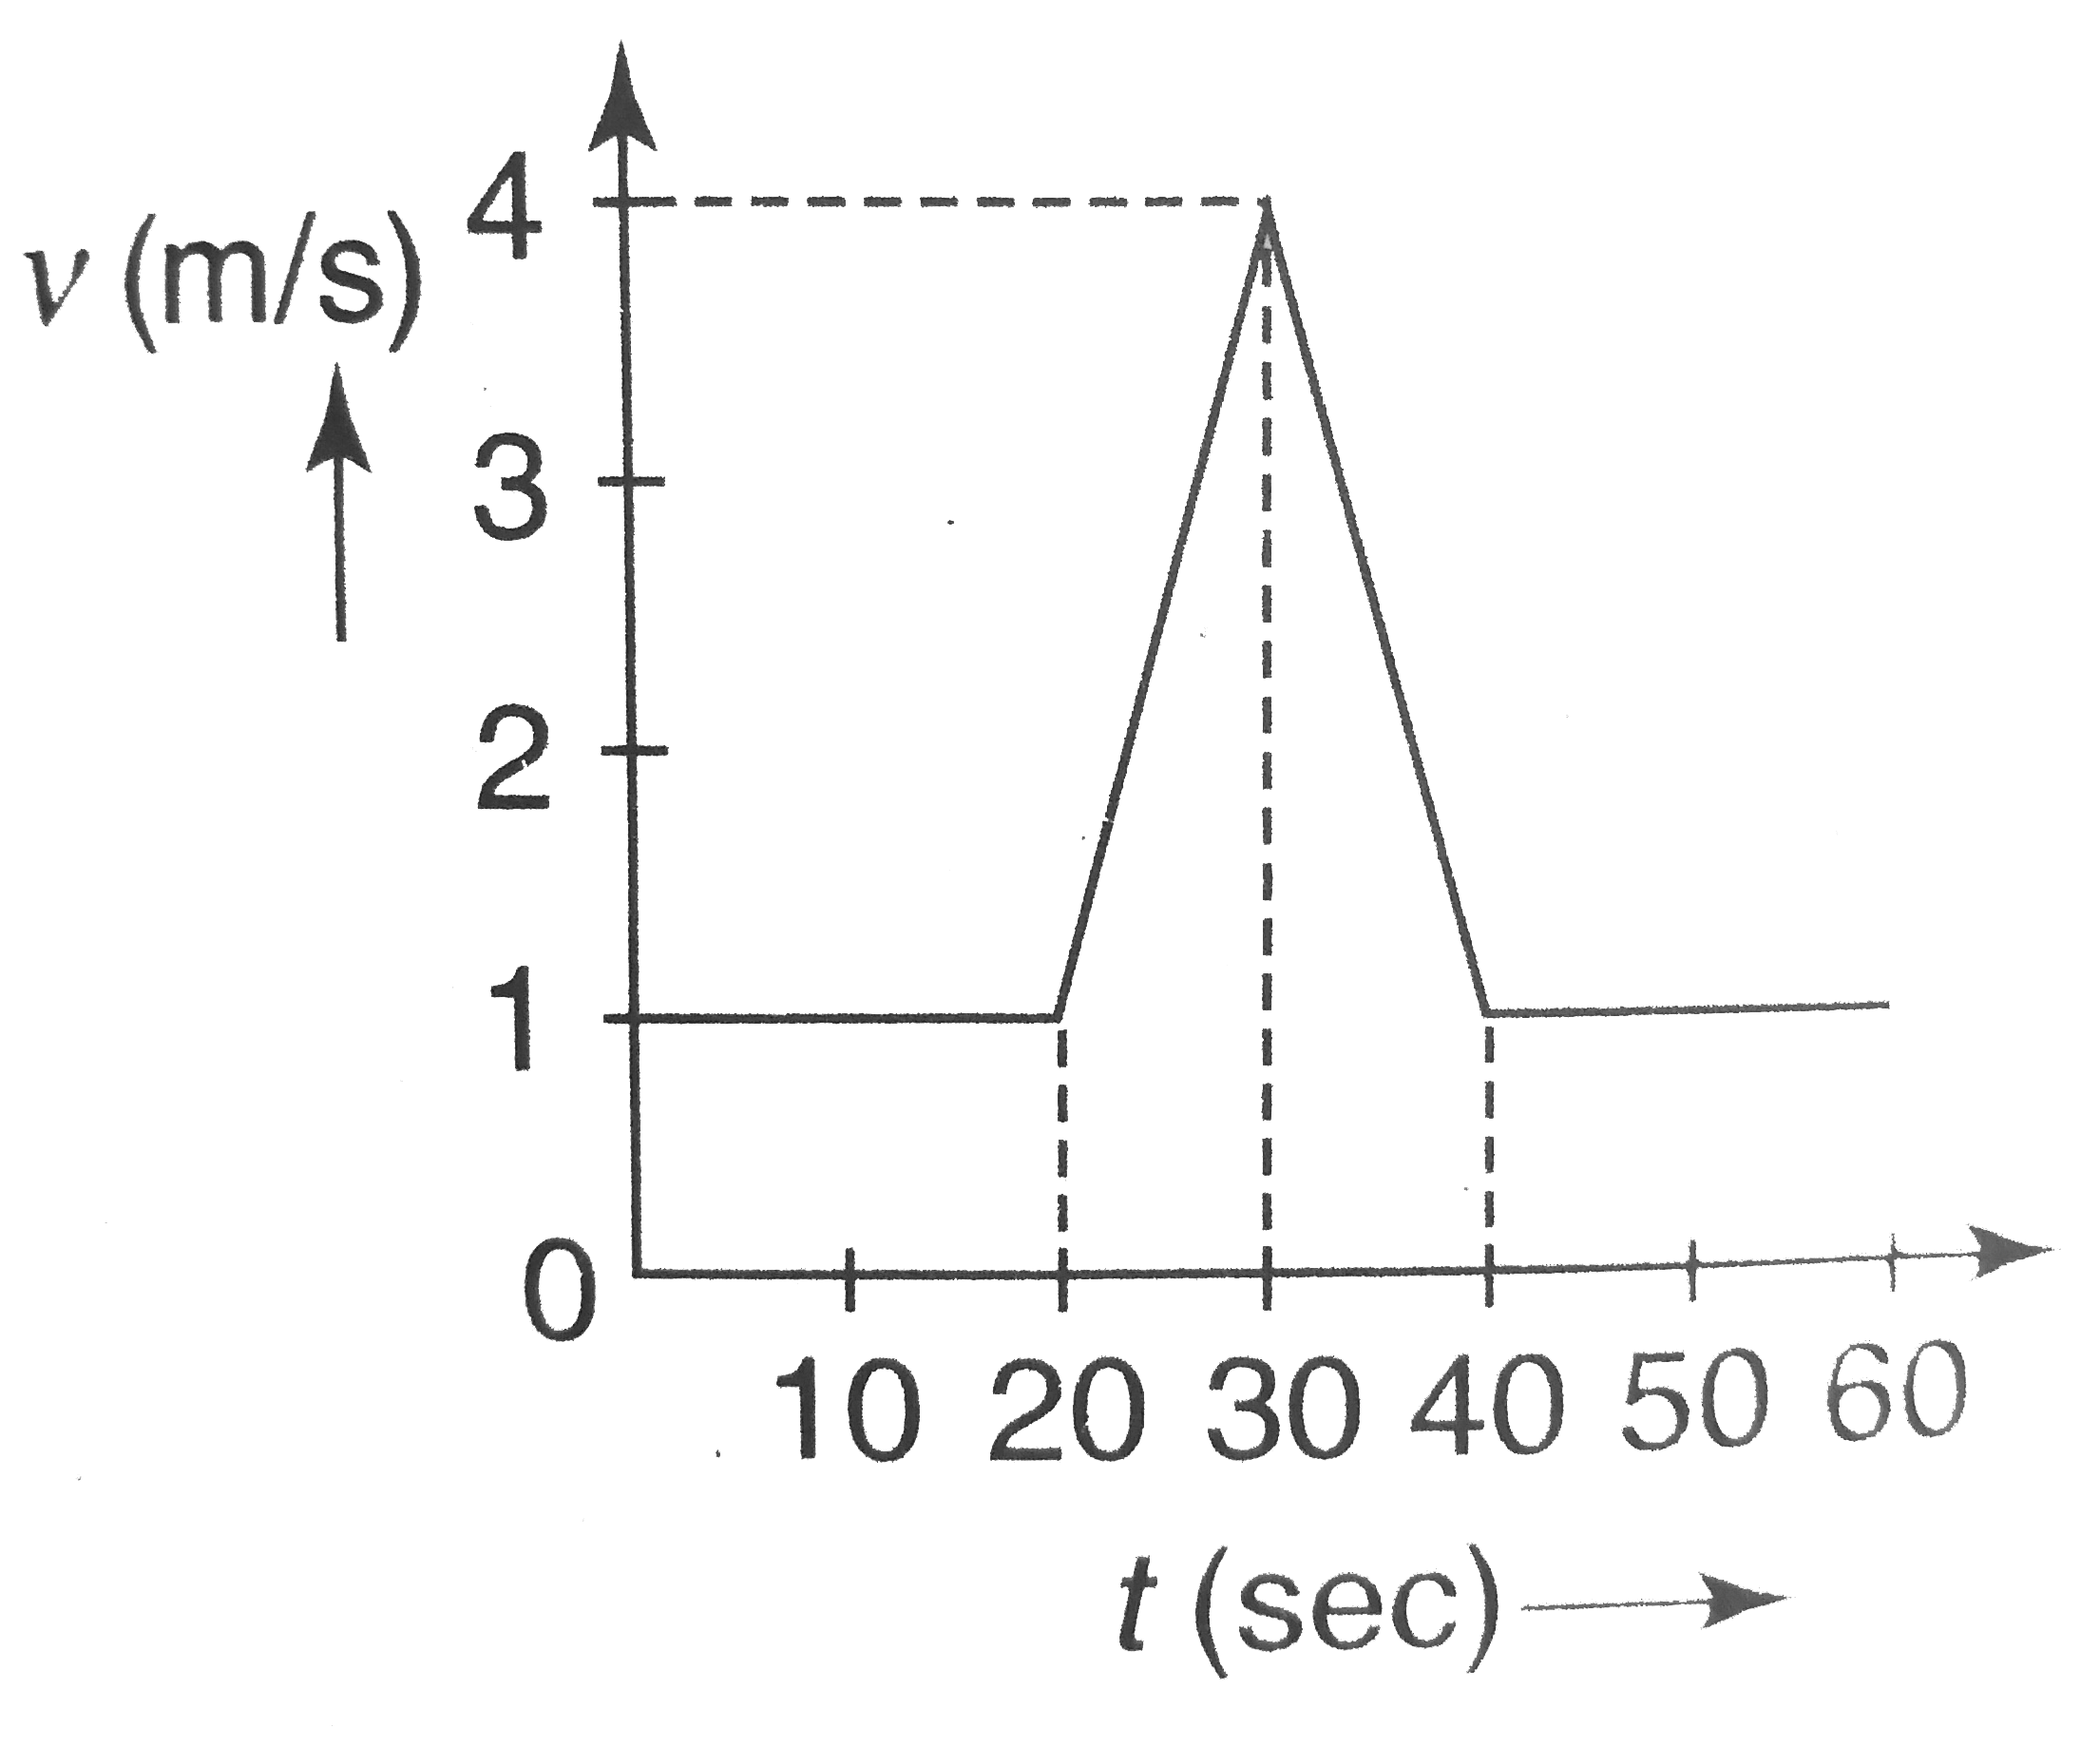
View SolutionThe v-t plot of a moving object ios shown in the figure. The average velocity of the object during the first 10 s is
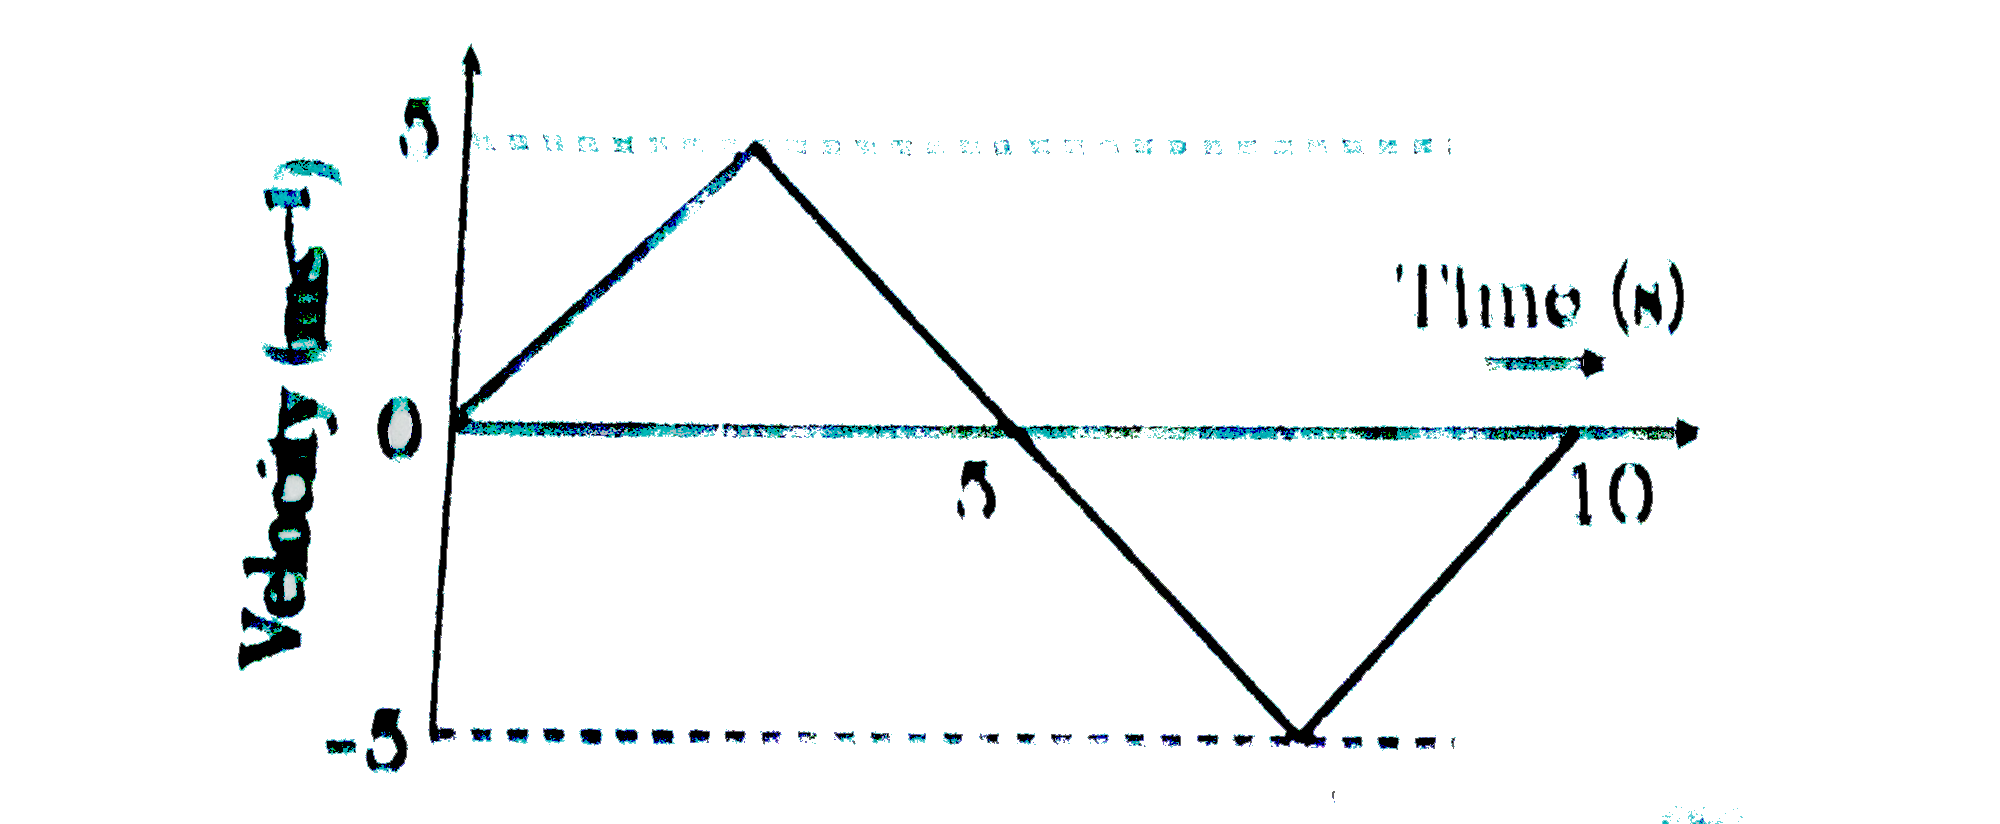
View SolutionThe v−t graph of a moving object is given in figure. The maximum acceleration is
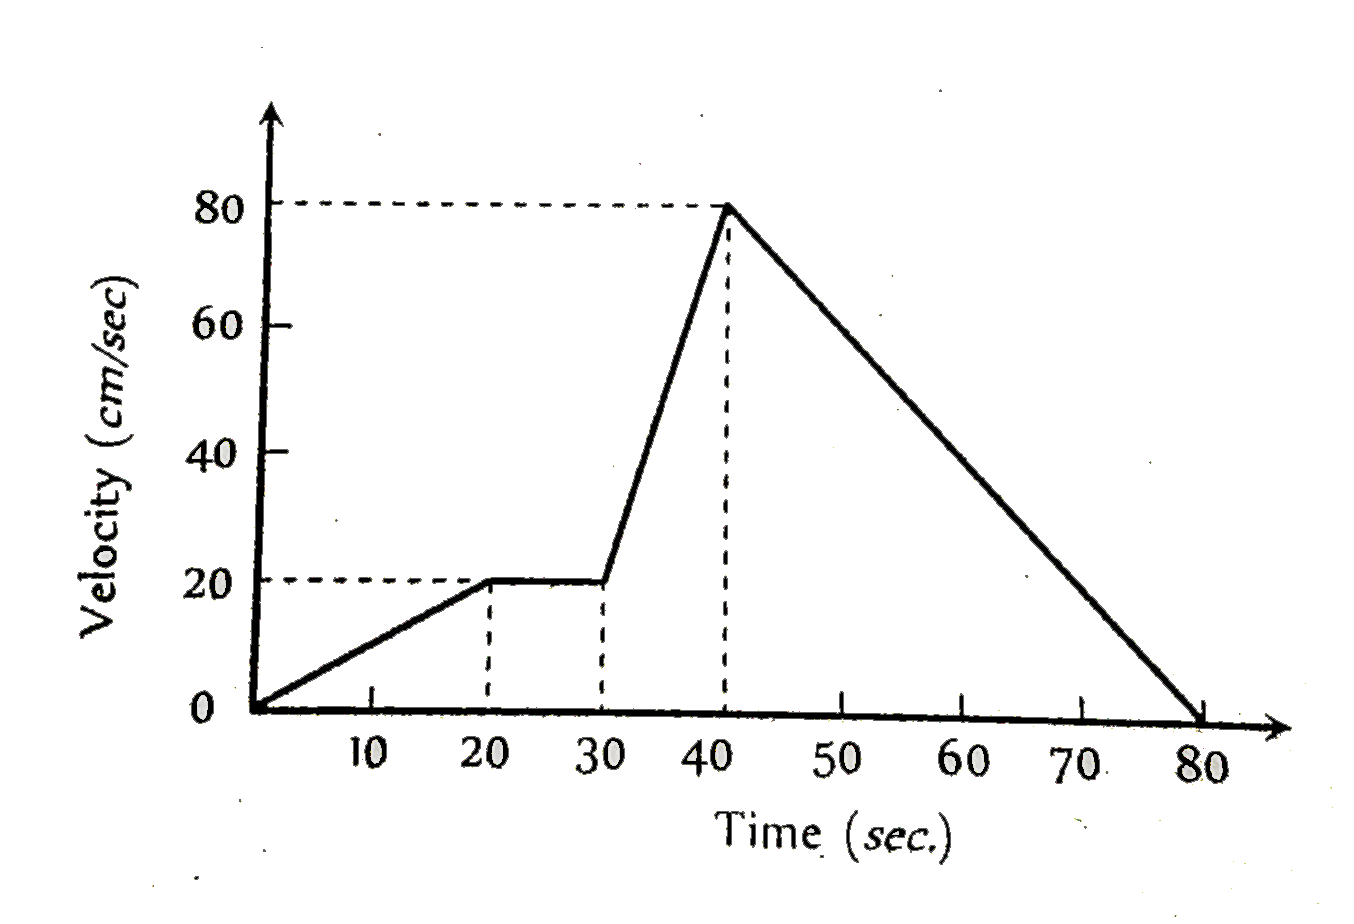
View Solutionvelocity time graph of a particle is shown in figure. Find displacement of the particle.
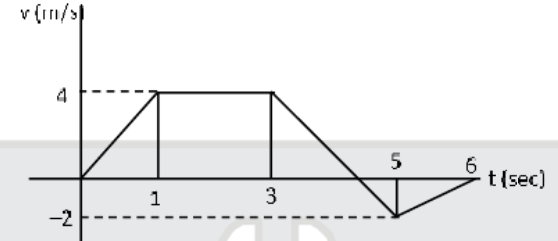
View SolutionThe velocity-time graph of an object is given below. Calculate the average acceleration of the object in the time interval of 4 s to 6 s.
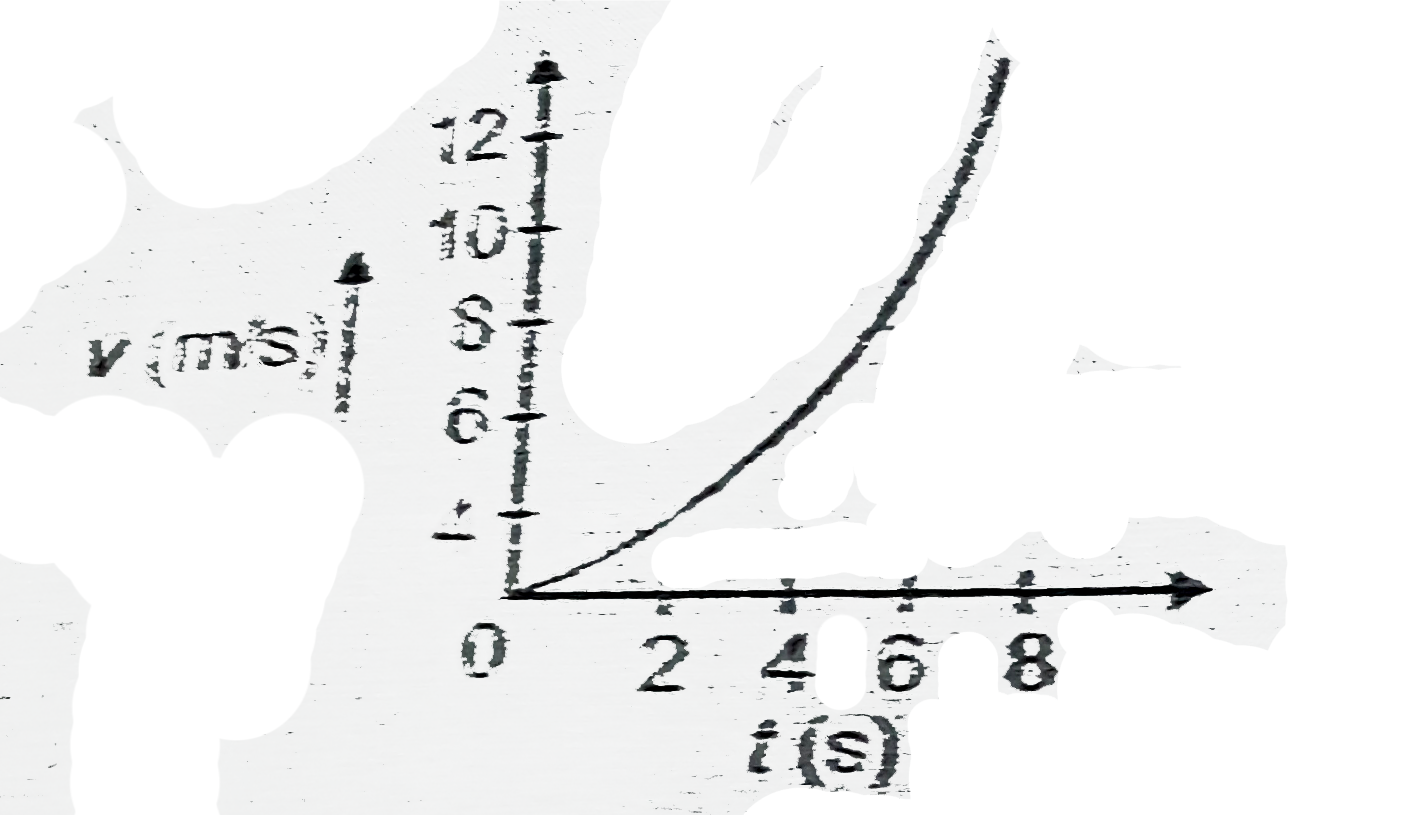
View SolutionThe velocity-time graph of an object is shown below. The acceleration of the object is
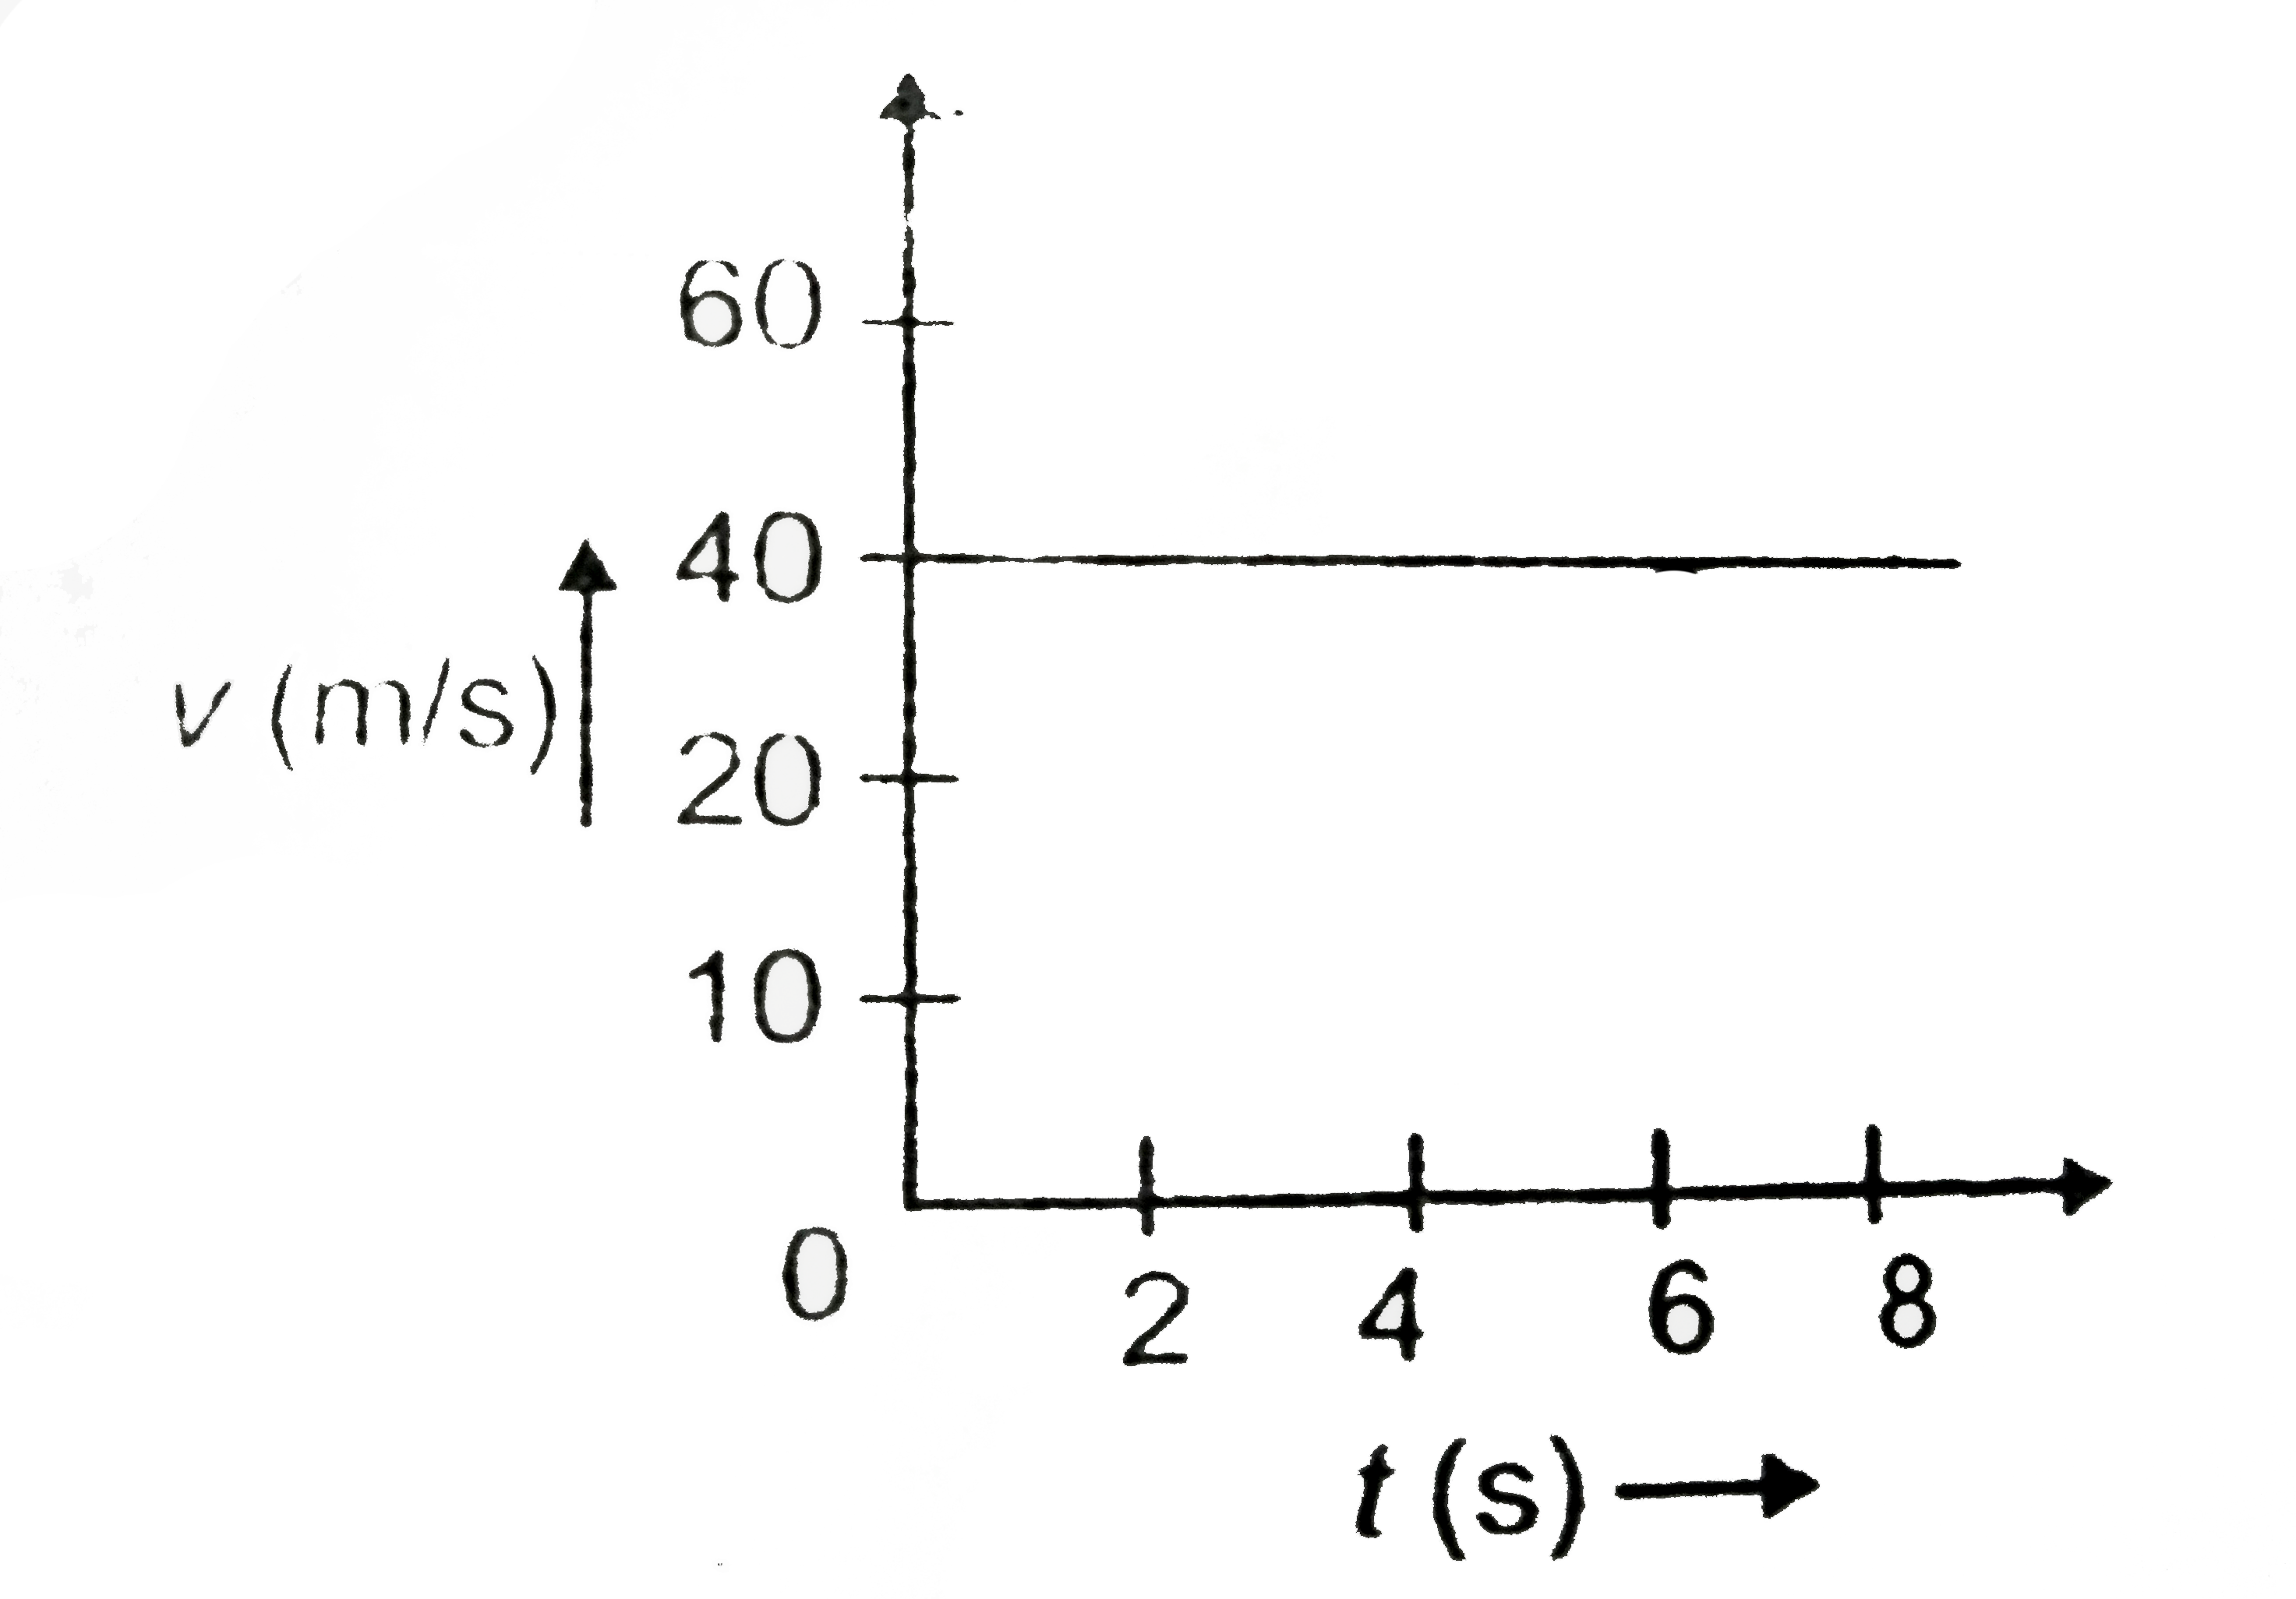
View SolutionThe velocity-time graph of an objects is as shown. The displacement during the interval 0 to t4 is
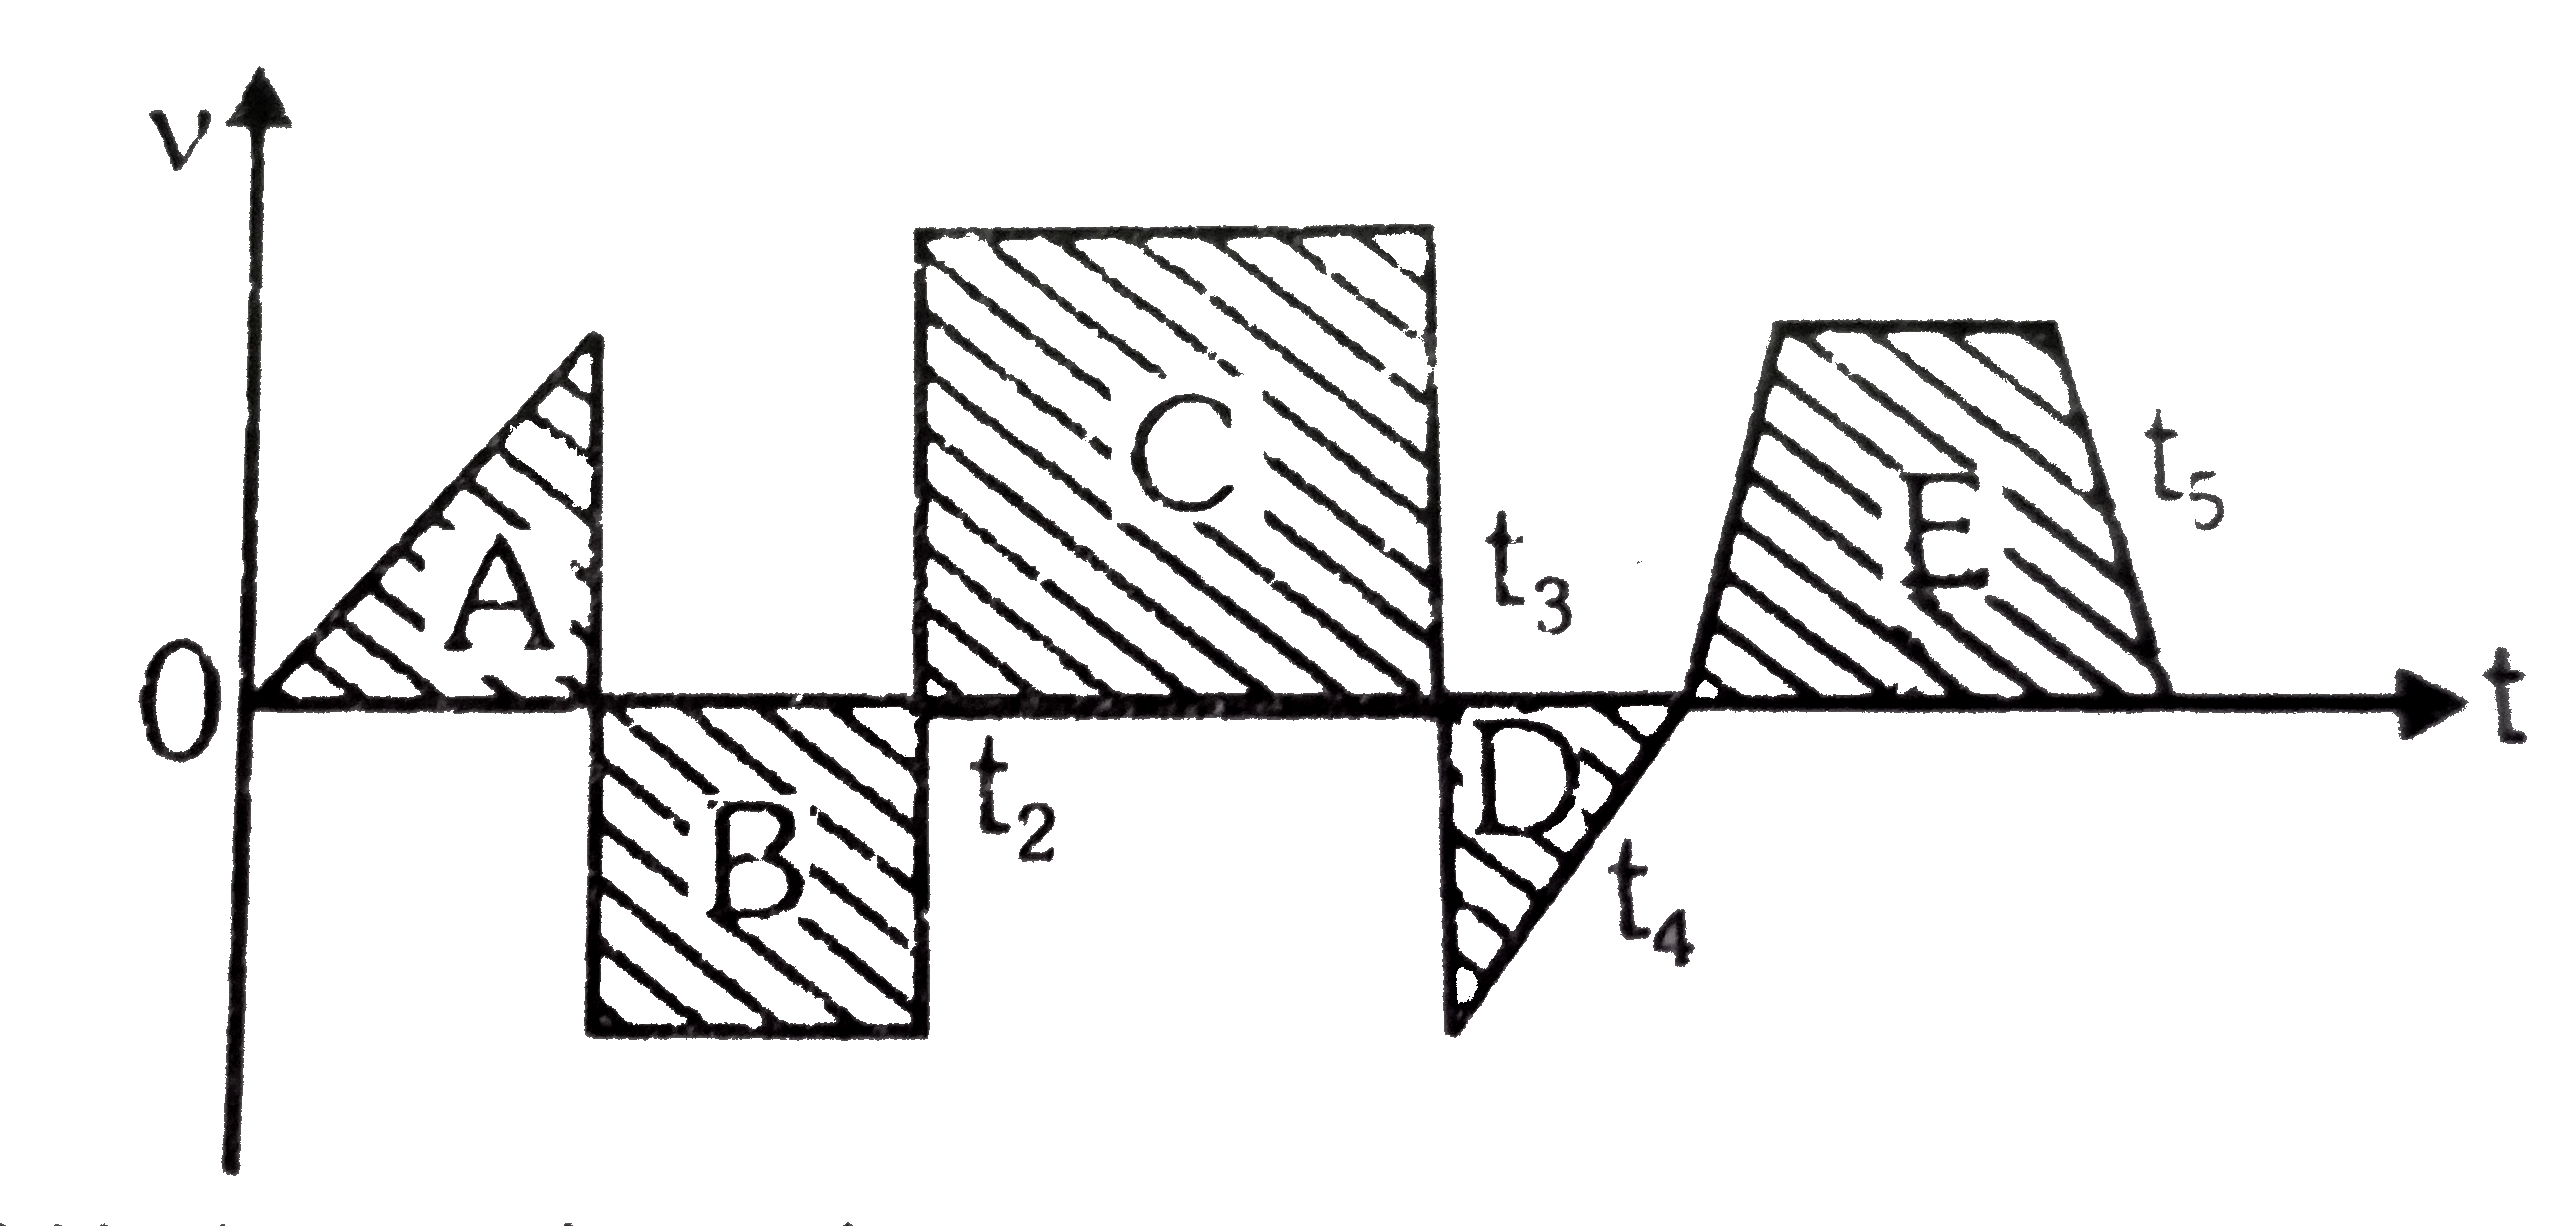
View SolutionThe velocity (v)-time (t) graph of a partide moving along a straight line is as shown in the figure. The displacement of the particle from t = 0 to t = 4 is
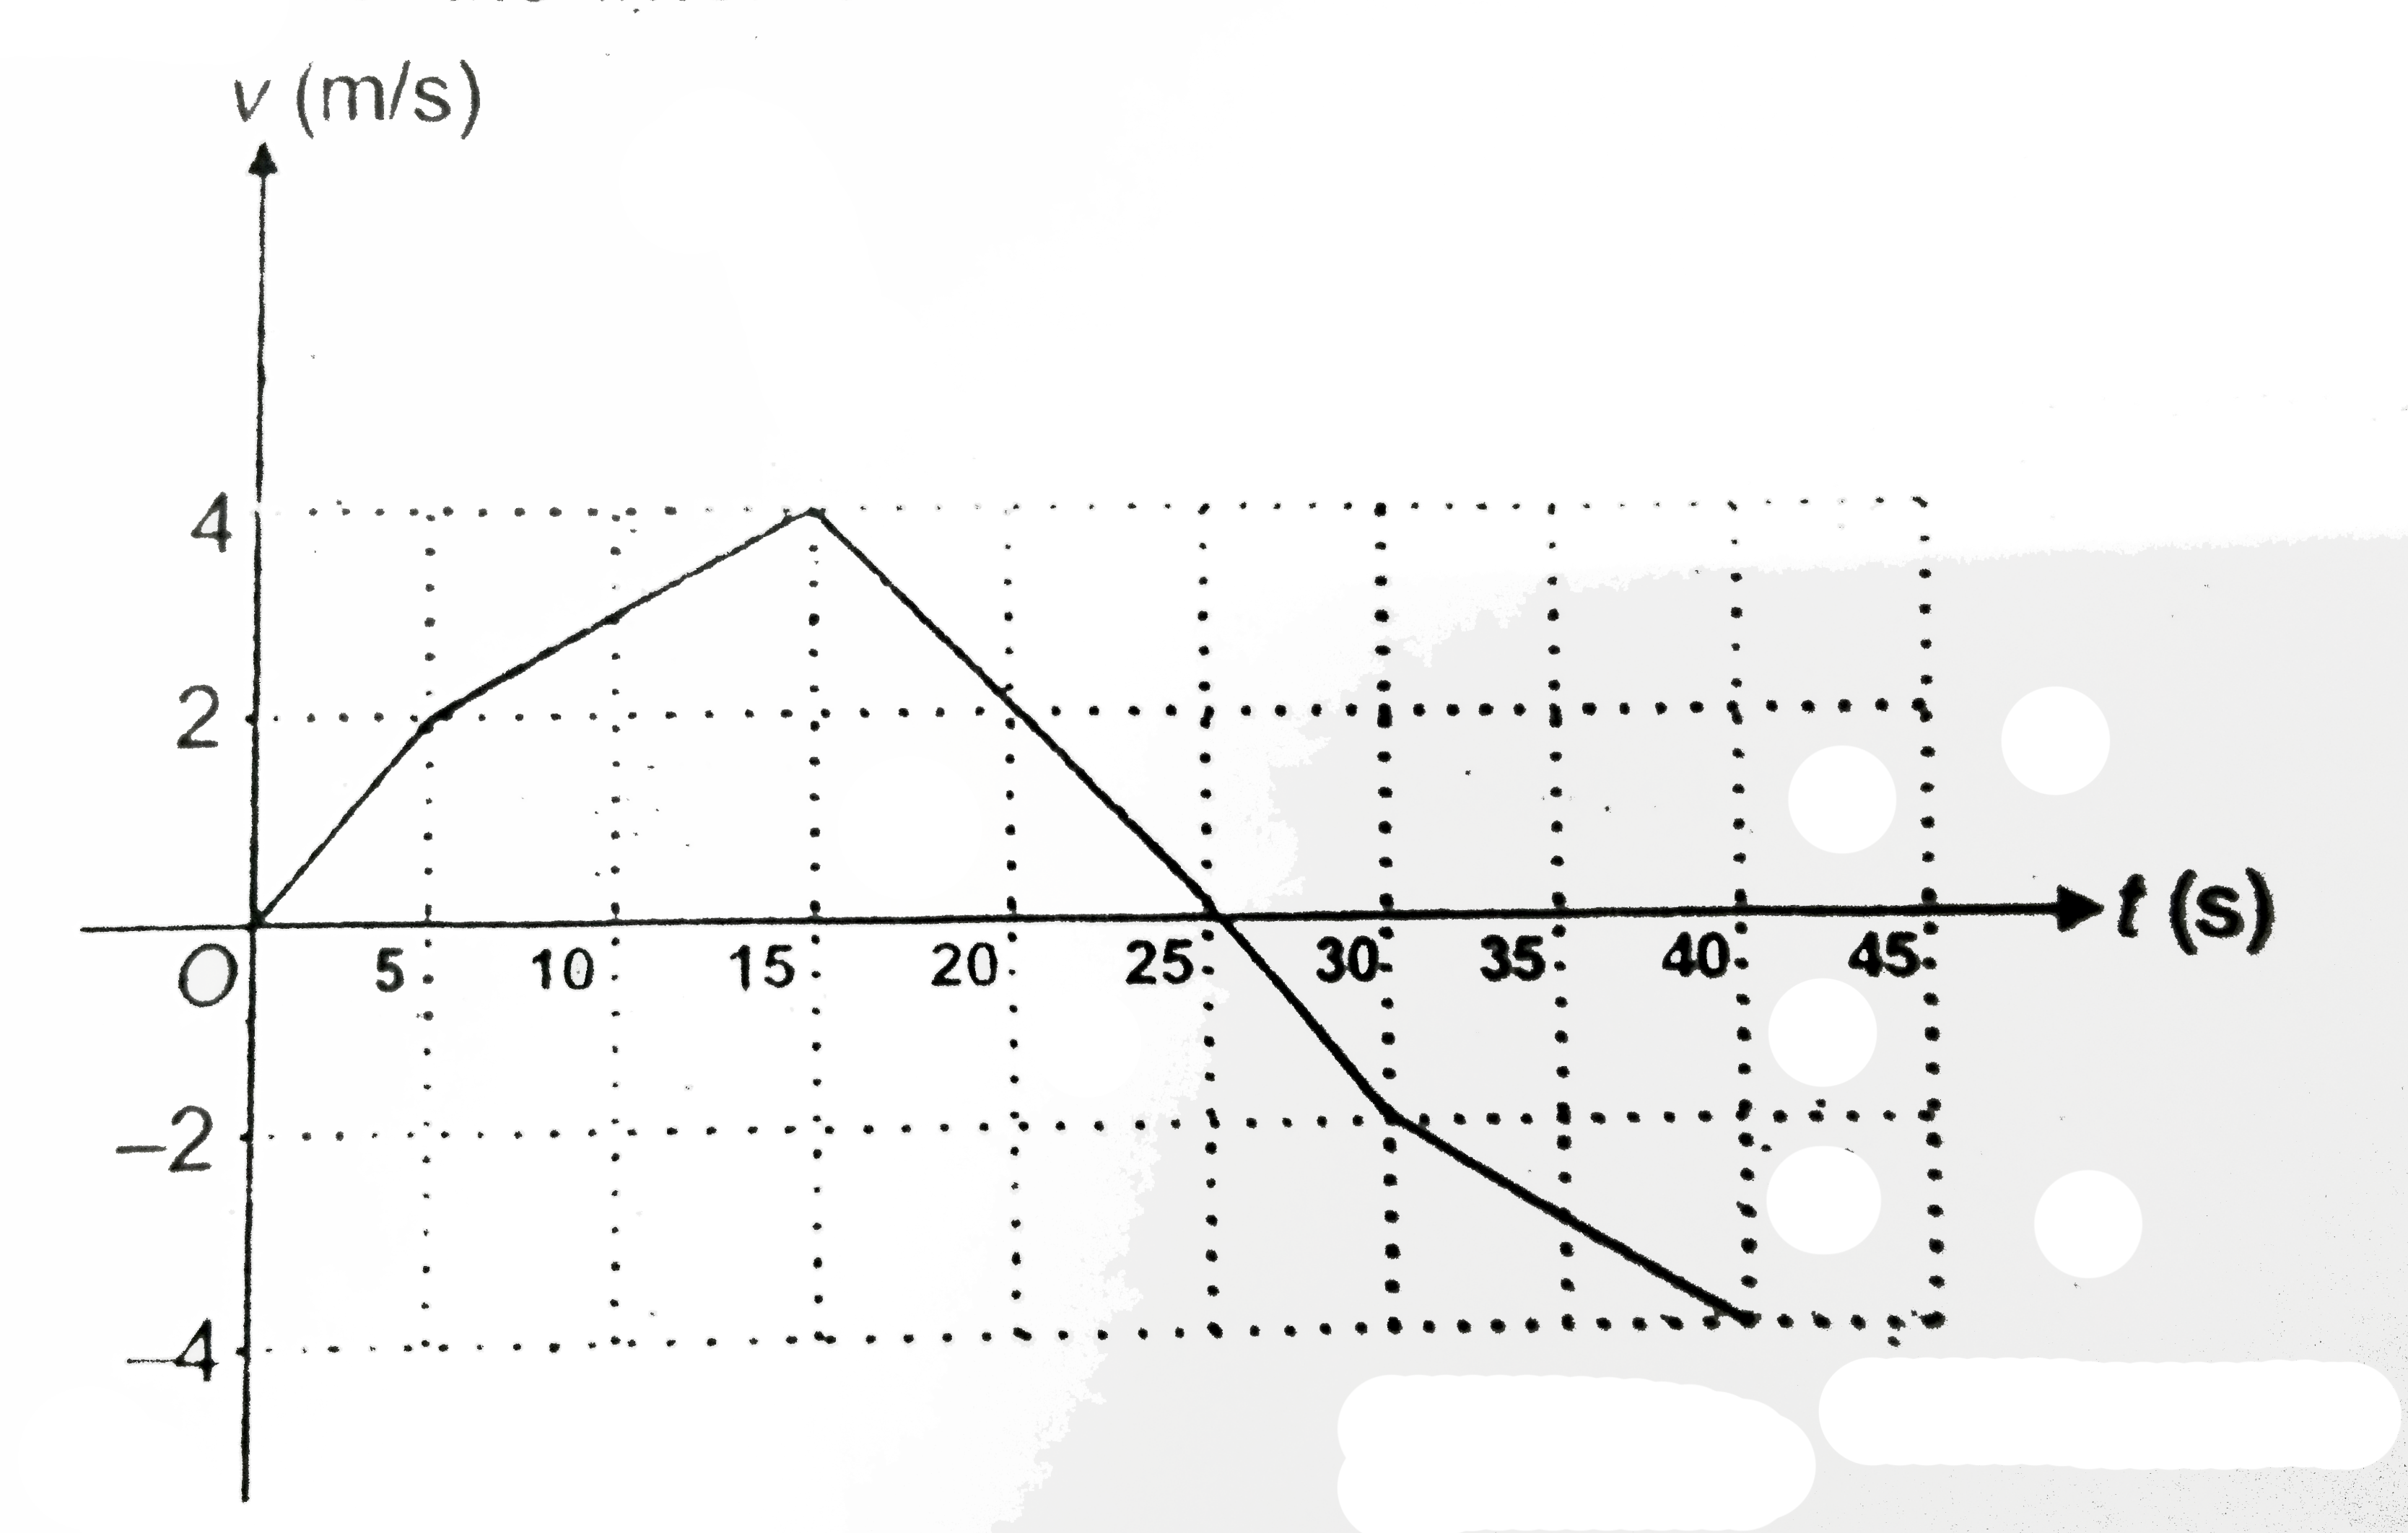
View SolutionThe velocity - time graph for linear motion of an object is as shown. Find
(a) The distance travelled and
(b) Displacement for the interval between 5 s and 40 s.
View Solution
