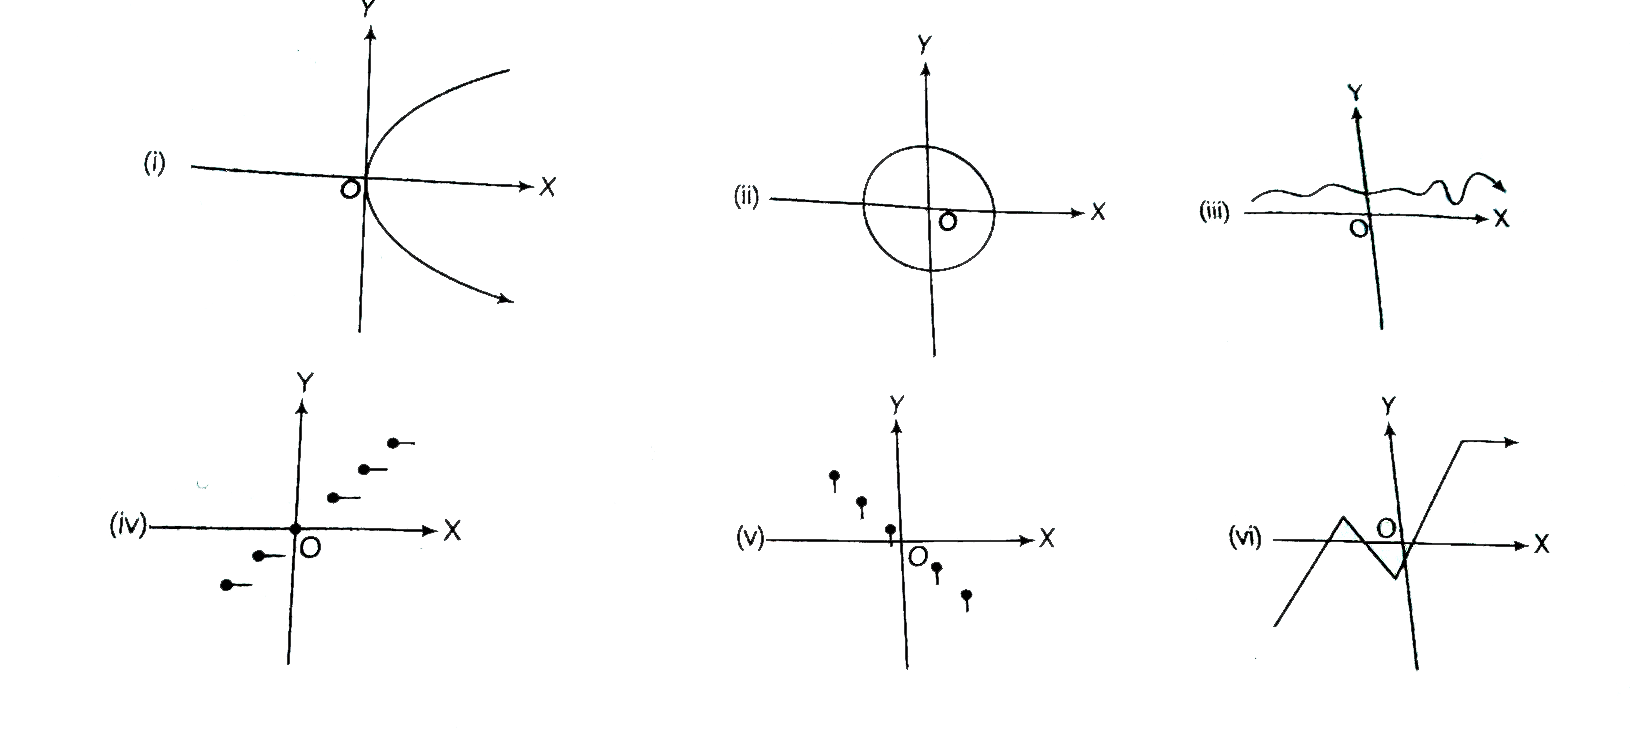
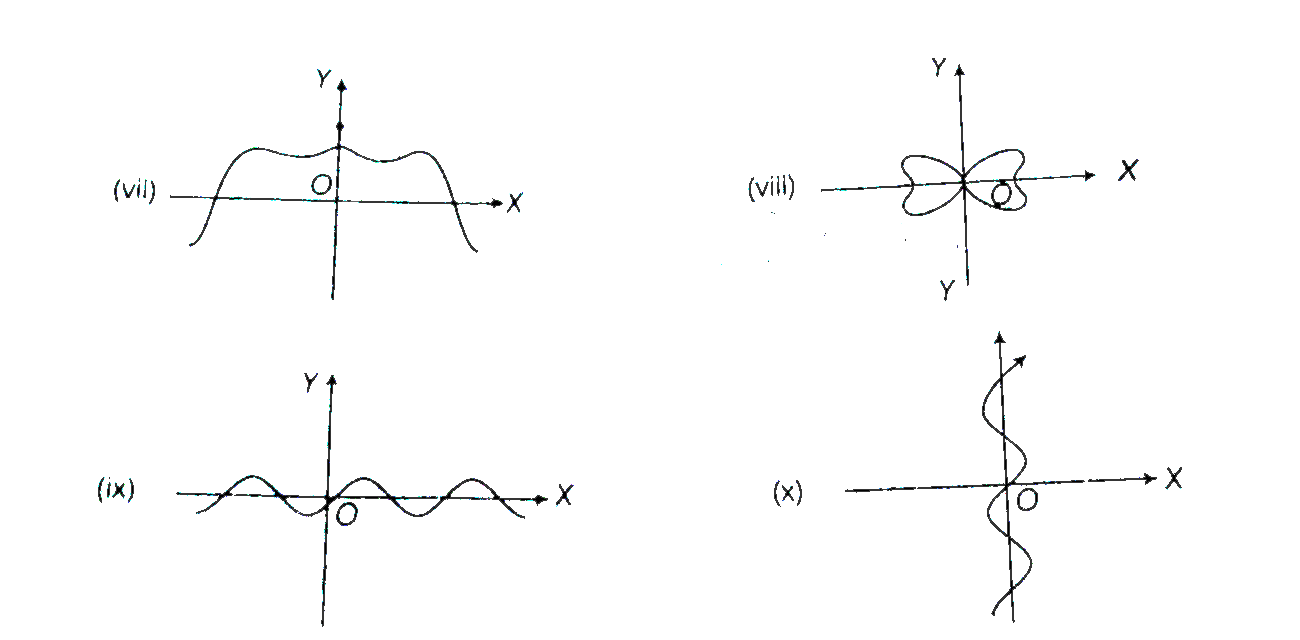
Which of the following graphs correctly shows variation of coefficient of volume expansion of copper as a function of temperature ?


The correct Answer is:A
Step by step video solution for Which of the following graphs correctly shows variation of coefficient of volume expansion of copper as a function of temperature ? by Physics experts to help you in doubts & scoring excellent marks in Class 11 exams.
Similar Questions
Knowledge Check
- Question 1 - Select One
Which of the following graph shows the variationi of density of water increase in temperature ?
A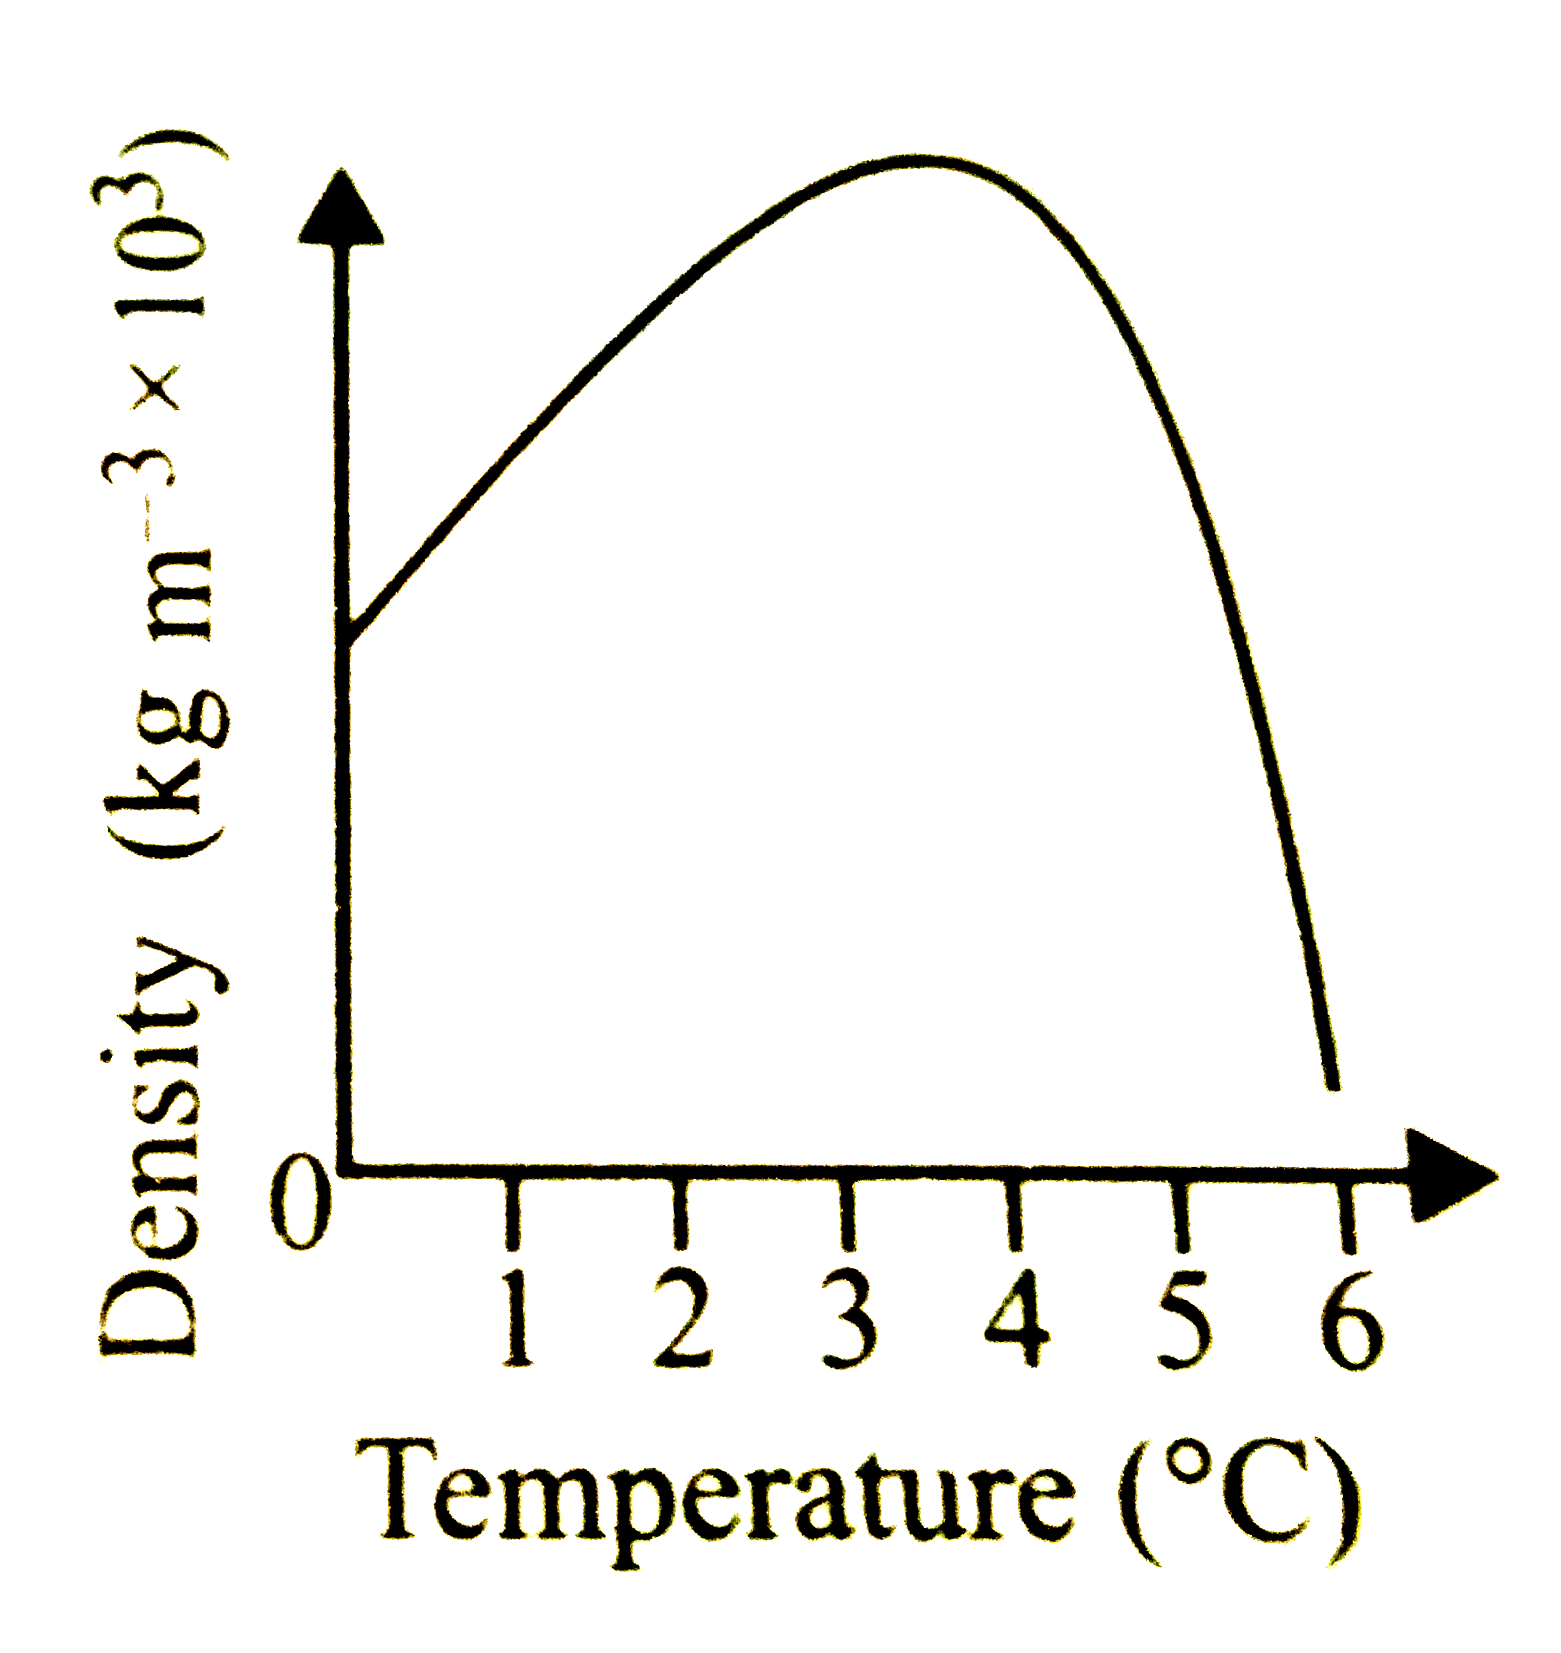 B
B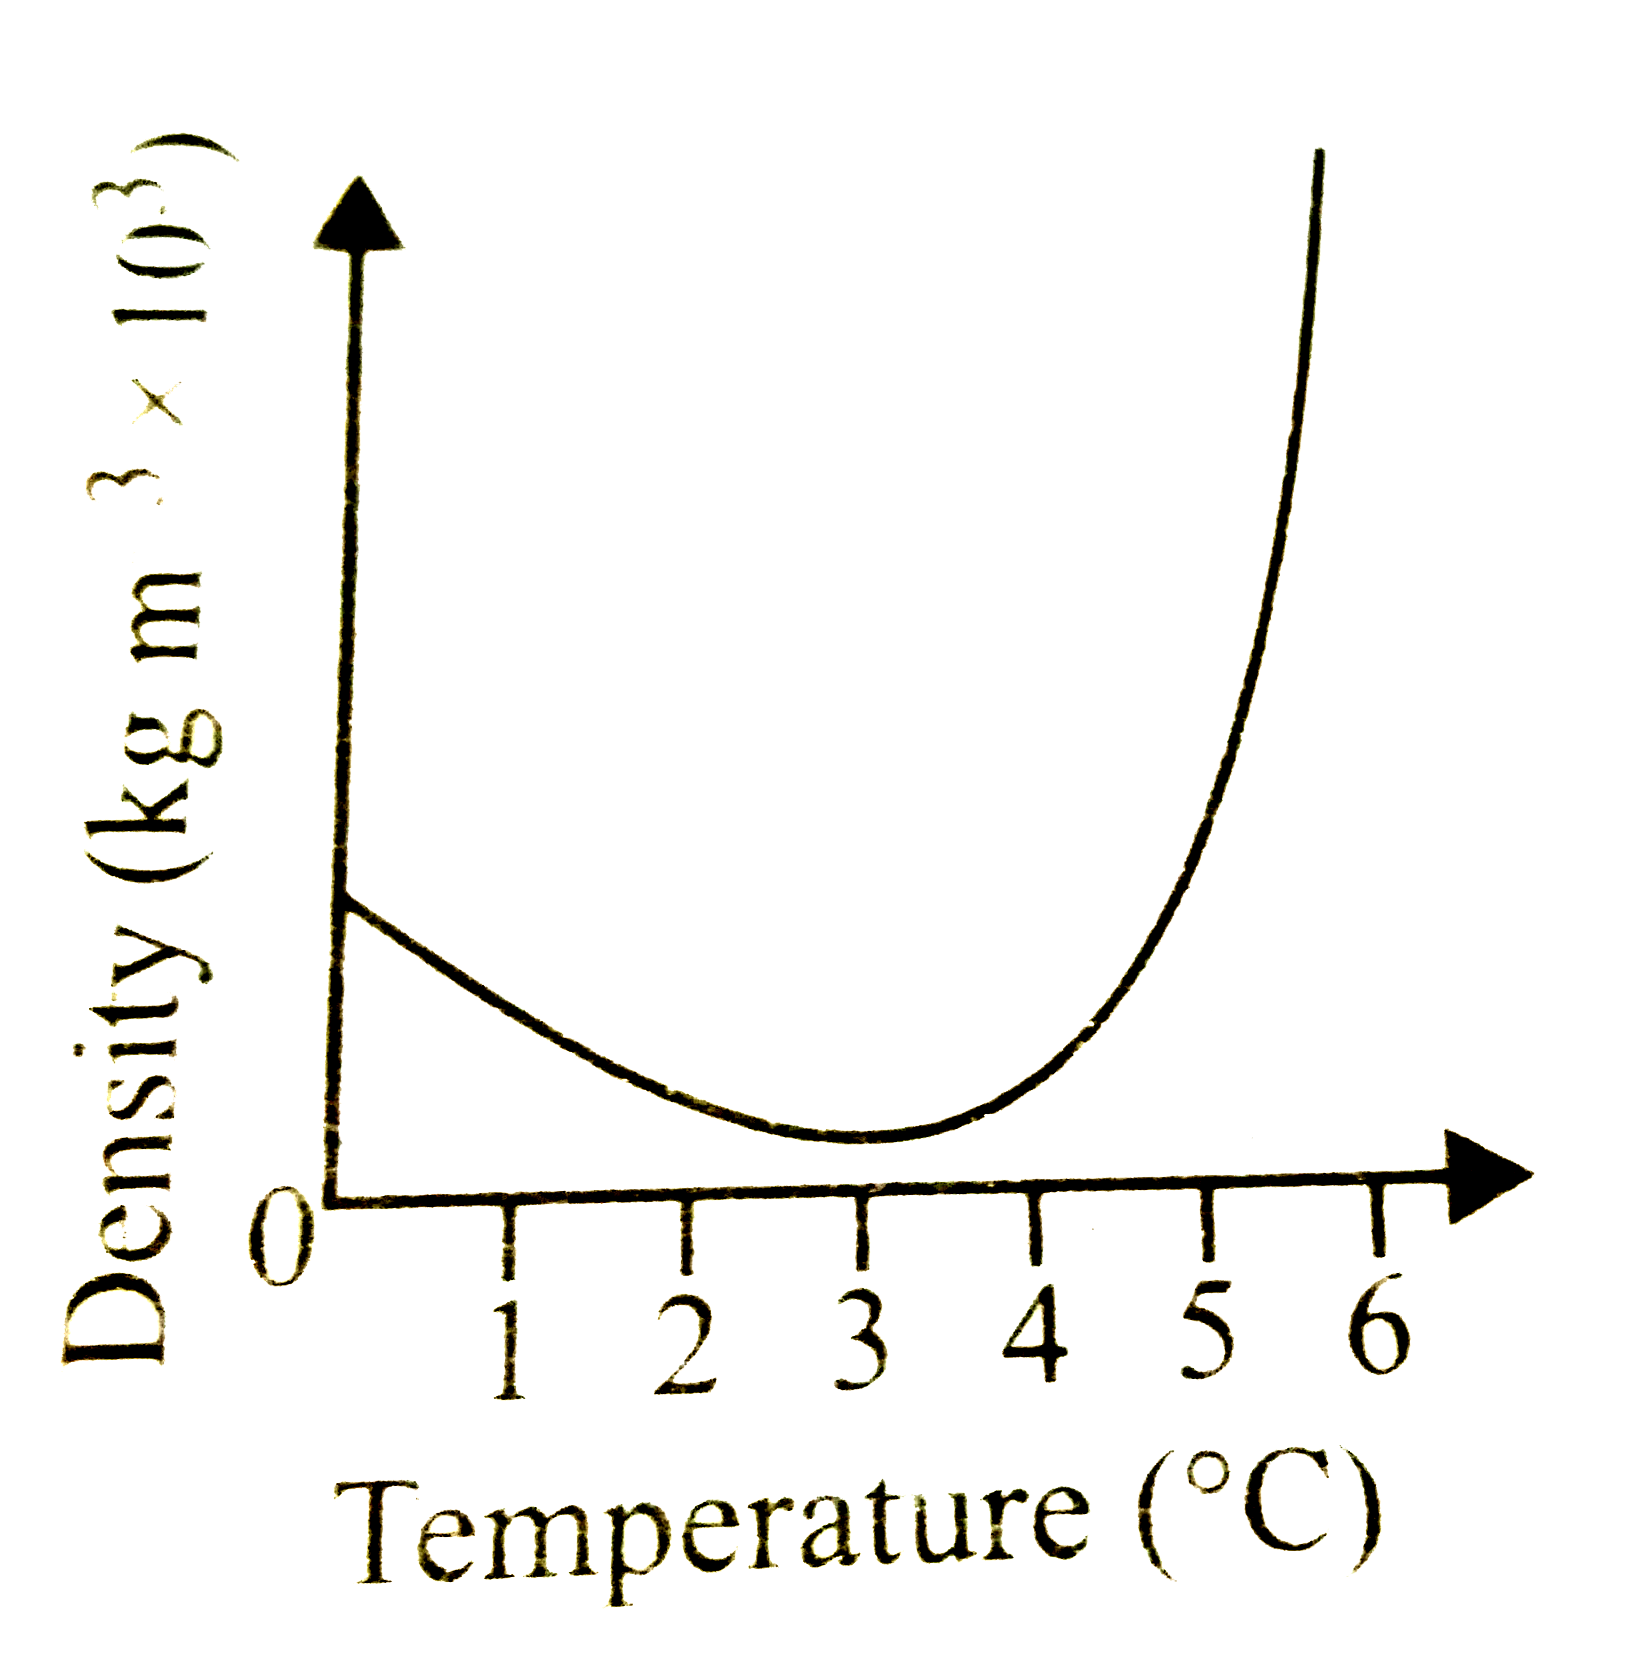 C
C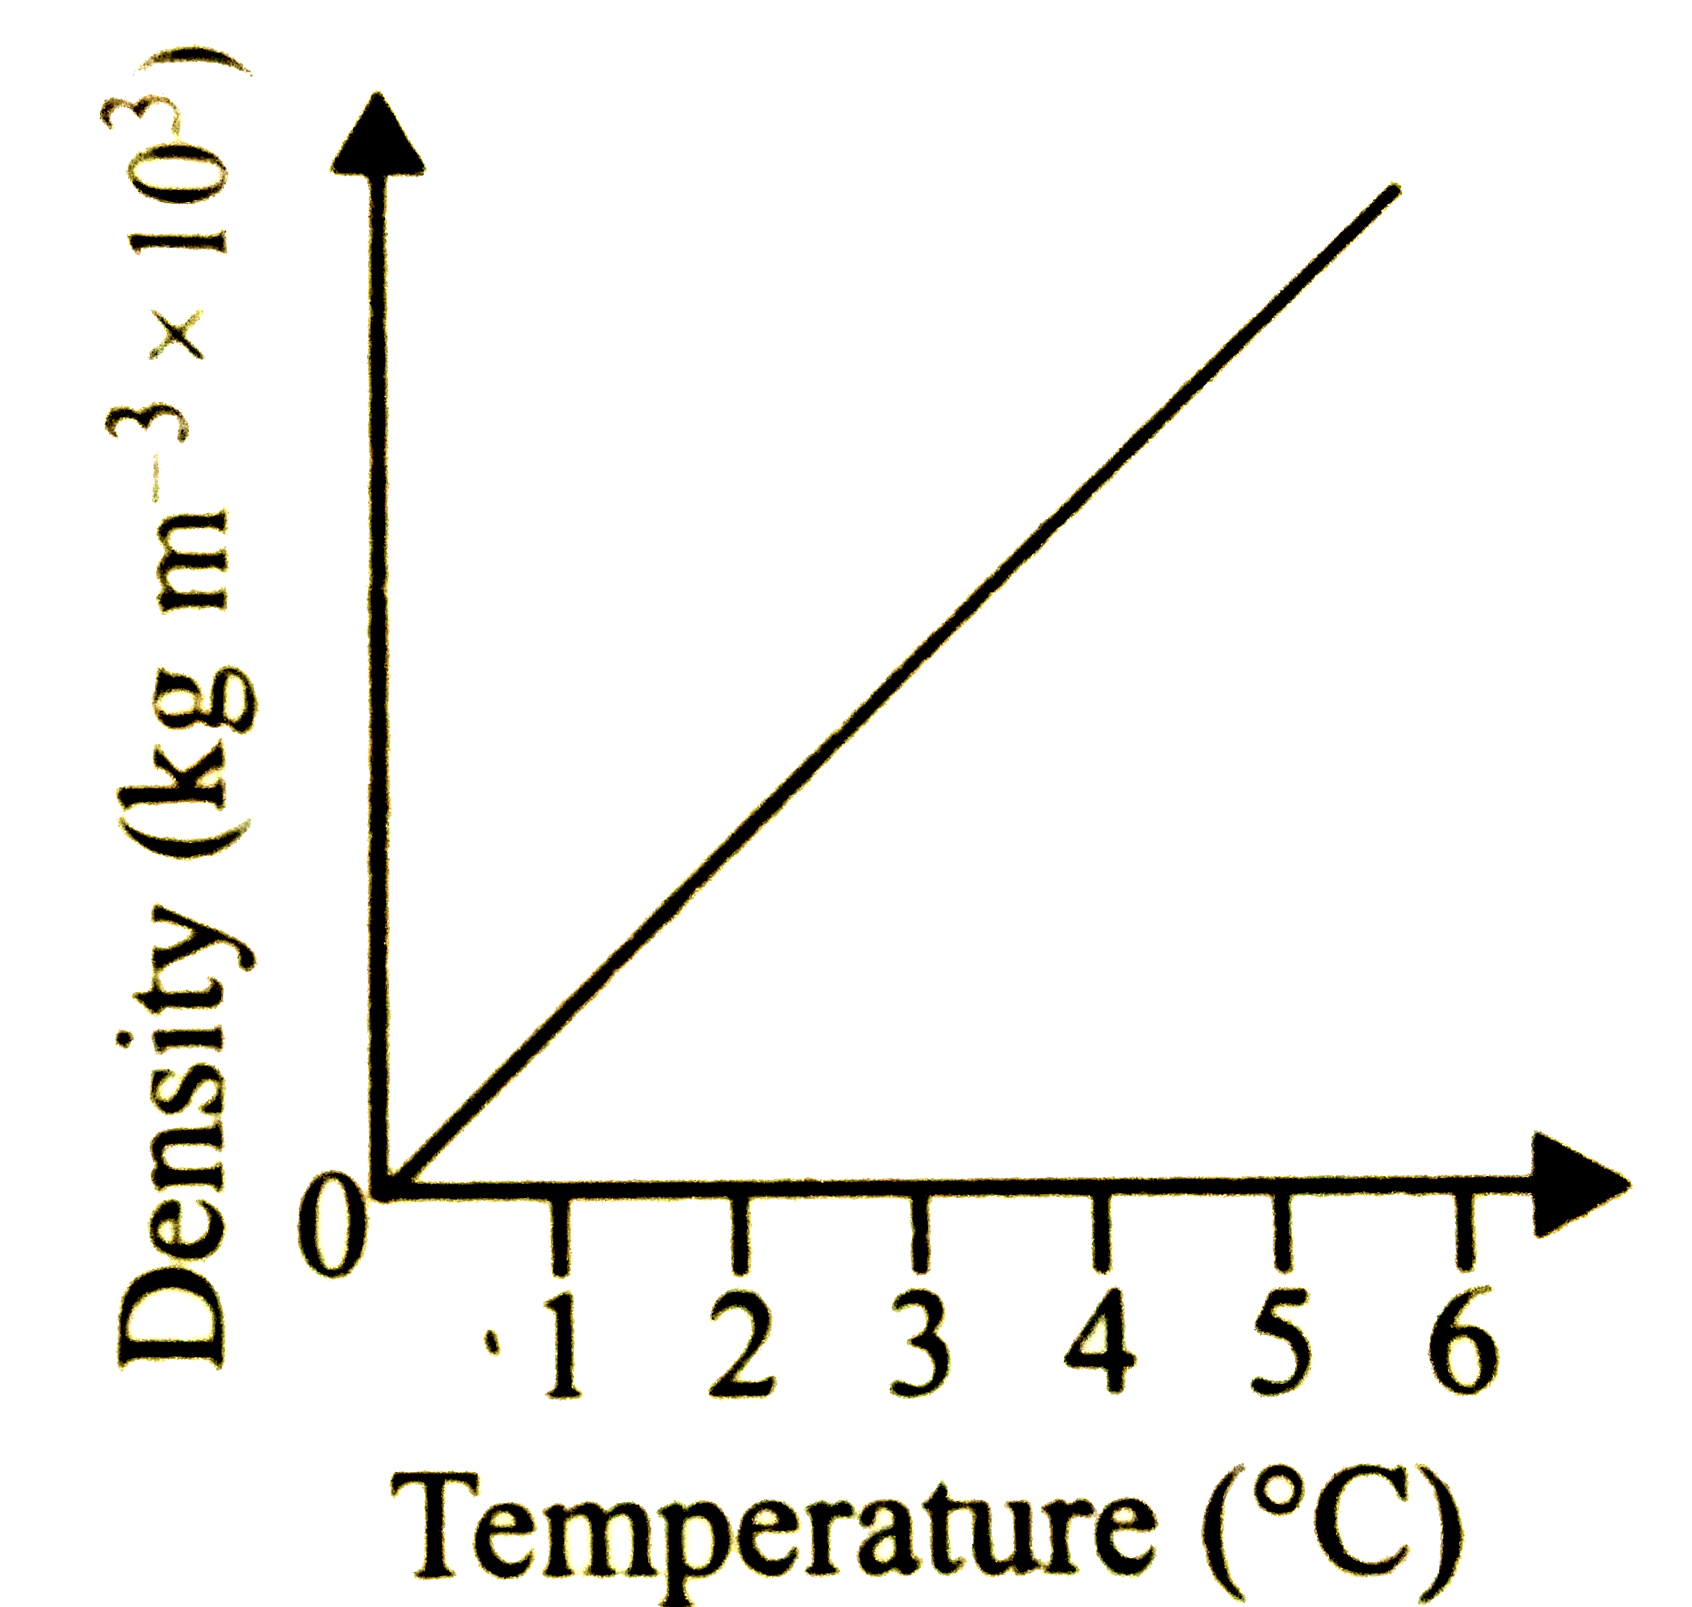 D
D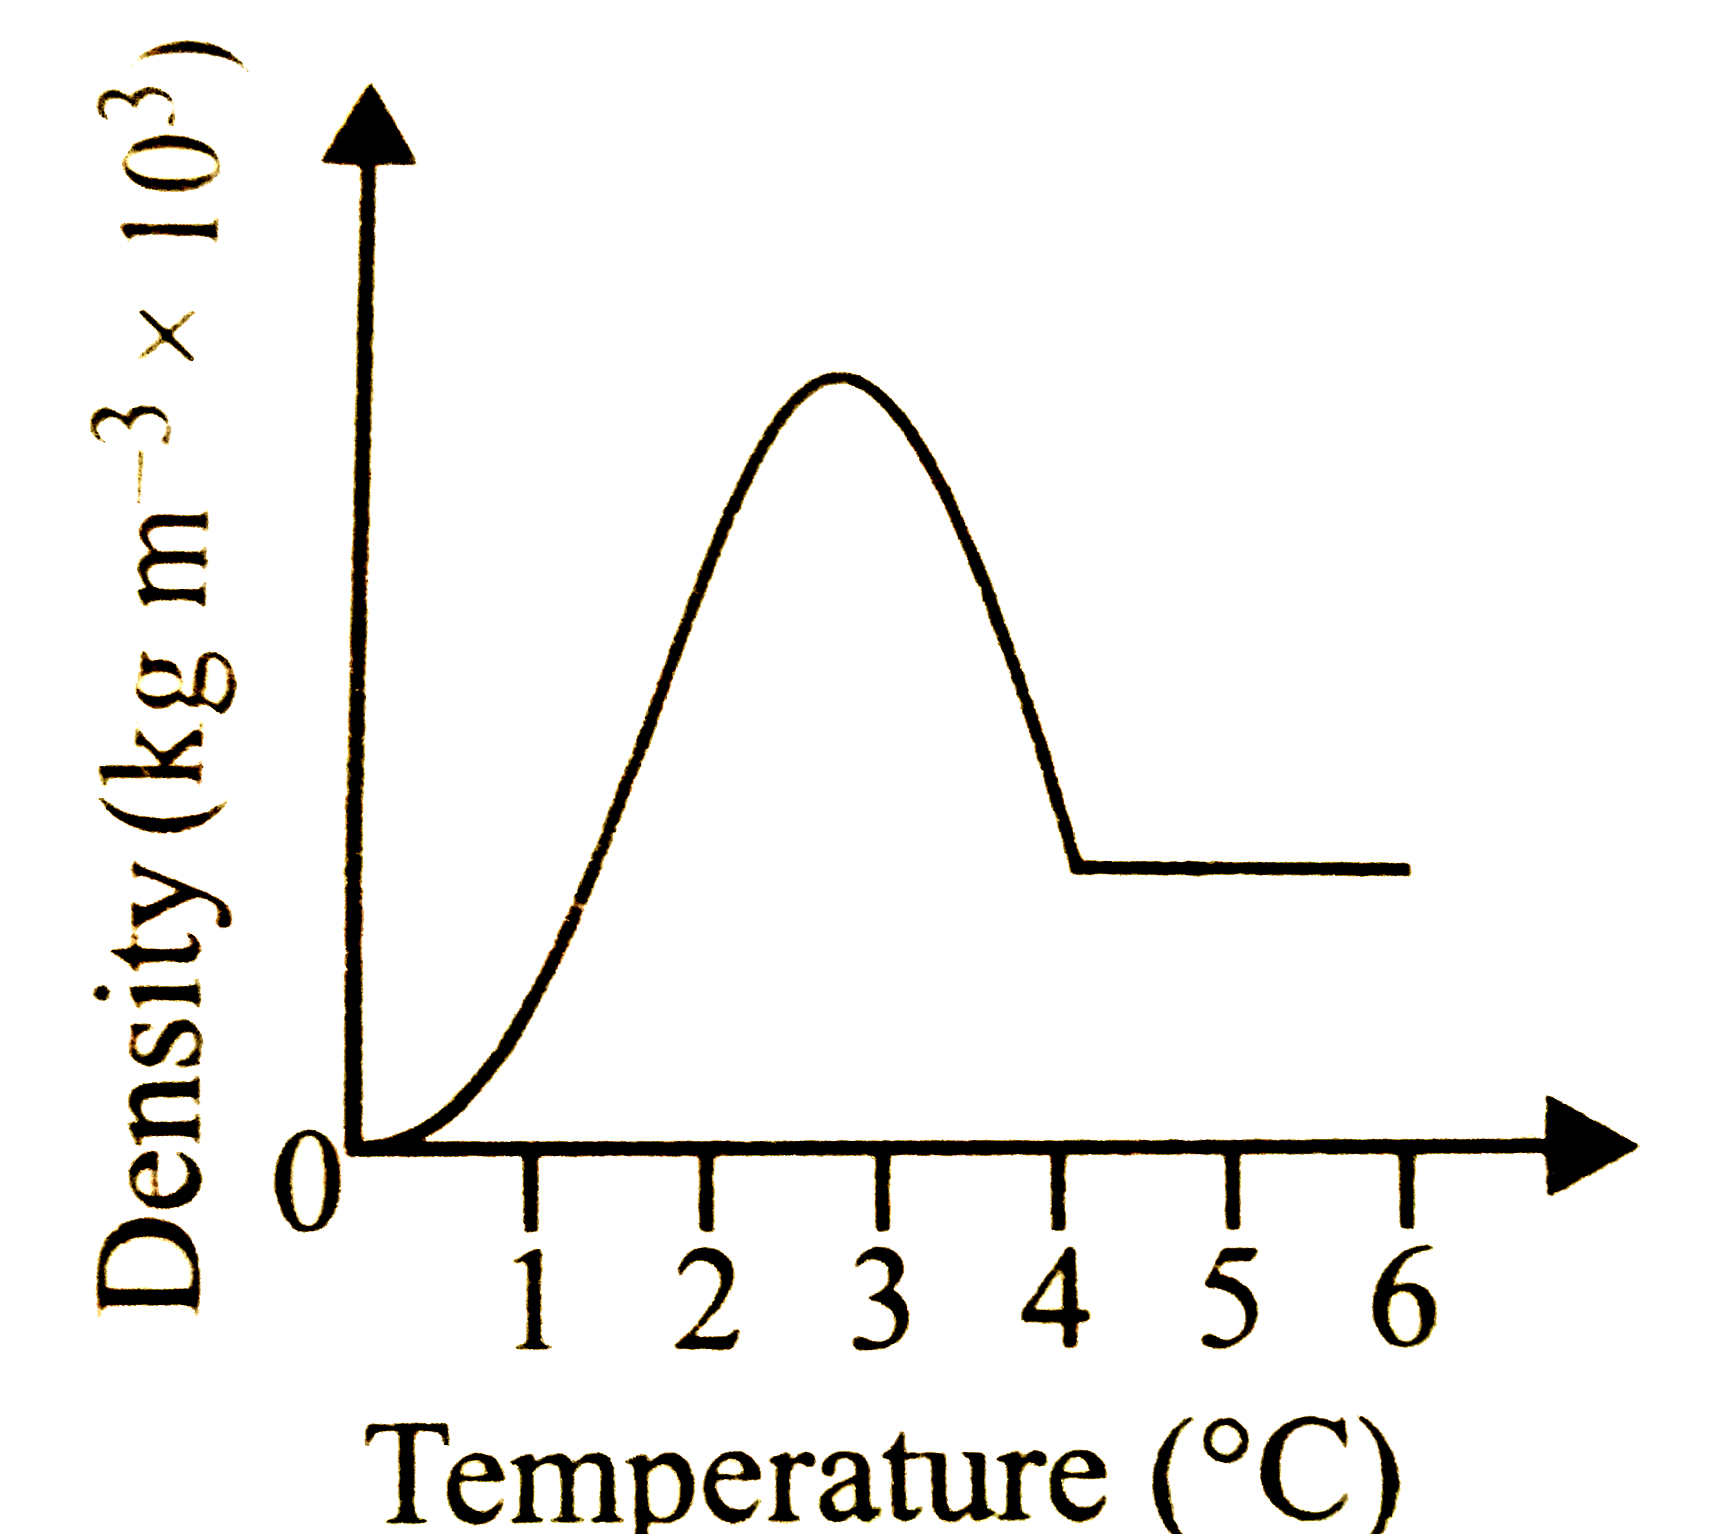
Mercury has a small coefficient of volume expansion.
View SolutionWhich of the following diagram correctly represents the variation of internal energy (U) of gas under expansion at constant temperature.
View SolutionShow variation of resistivity of copper as a function of temperature in a graph.
View SolutionWhich of the following graphs correctly represents the variation of β=−dV/dPV
with P for an ideal gas at constant temperature?View SolutionWhich of the following graphs correctly represents the variation of β=−dV/dPV
with P for an ideal gas at constant temperature?View SolutionWhich one of the following shows crossing over and variations
View SolutionWhich of the following graphs correctly represents the variation of β=−(dVdP)/V with P for an ideal gas at constant temperature
View Solution

