A body is moving unidirectionally under the influence of a source of constant power supplying energy. Which of the diagrams shown in figure correctly shows the displacement-time curve for its motion?
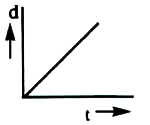
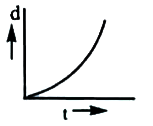
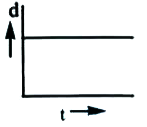
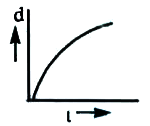
The correct Answer is:B
Step by step video solution for A body is moving unidirectionally under the influence of a source of constant power supplying energy. Which of the diagrams shown in figure correctly shows the displacement-time curve for its motion? by Physics experts to help you in doubts & scoring excellent marks in Class 11 exams.
Updated on:21/07/2023Similar Questions
A body is moving undirectionally under the influence of a source of constatn power. It displacement in time t is proportional to (i) t1/2 (ii) t (iii) t3/2 (iv) t2
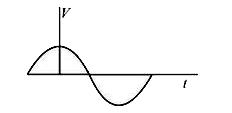
View SolutionVoltage across a capacitor varies as shown in the diagram. Which diagram correctly represents the current time curve?
View Solution
Knowledge Check
A raindrop falling from a height h above ground, attains a near terminal velocity when it has fallen through a height (3/4)h. Which of the diagrams shown in figure correctly shows the change in kinetic and potential energy of the drop during its fall up to the ground ?
A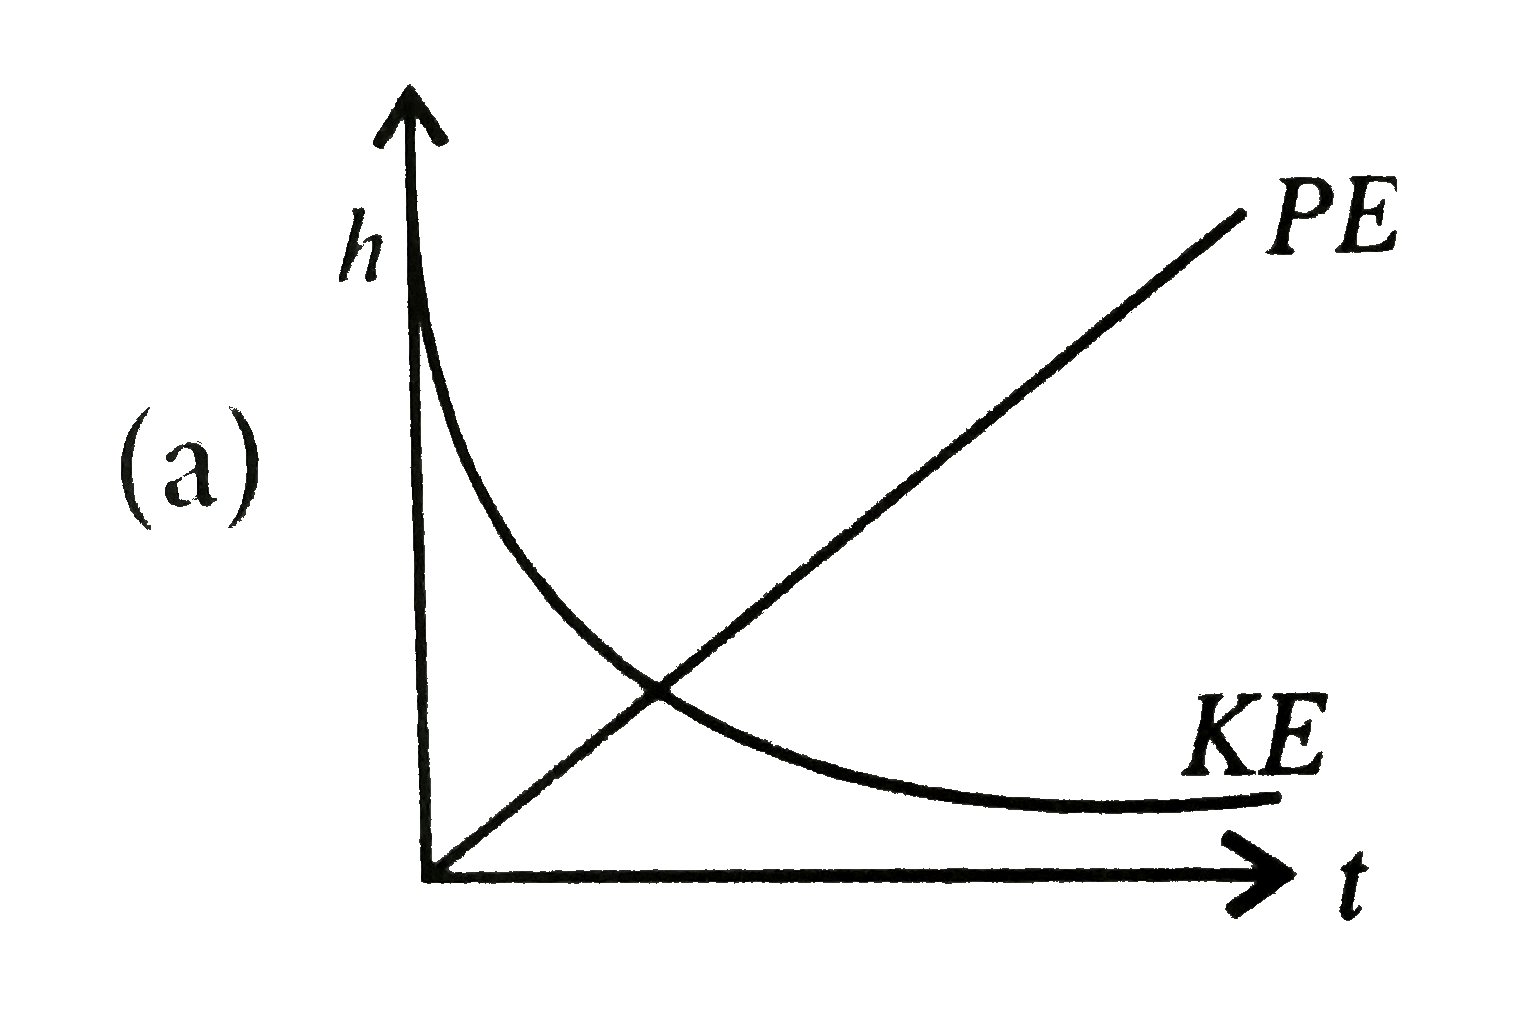 B
B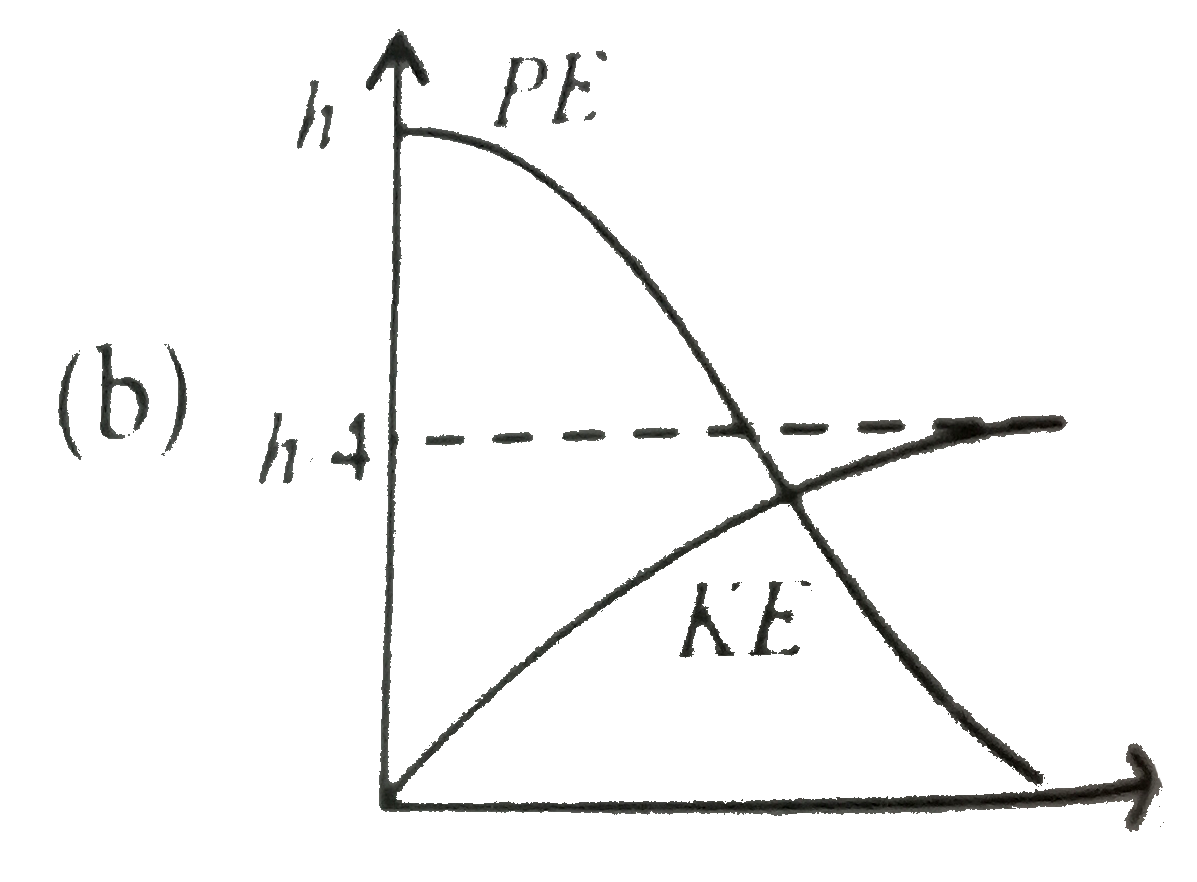 C
C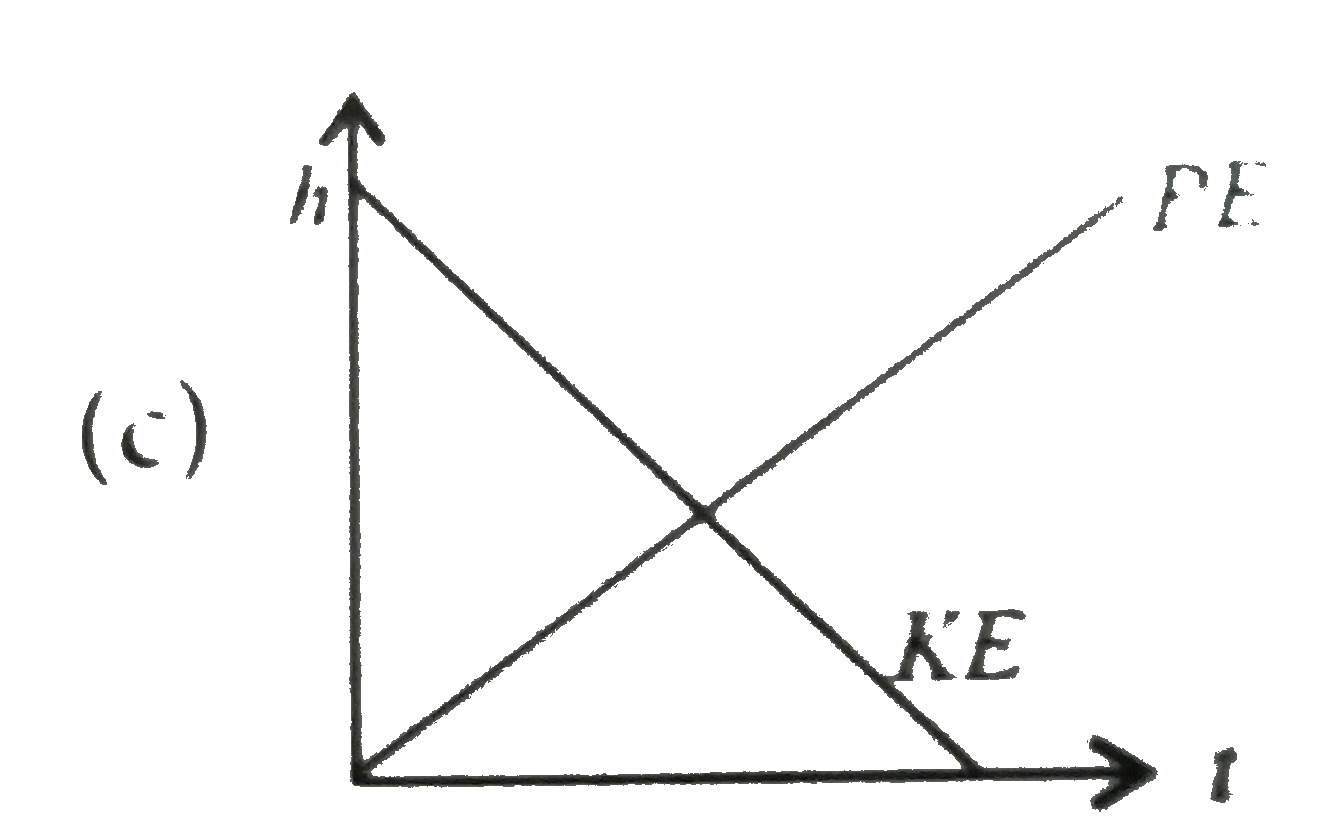 D
D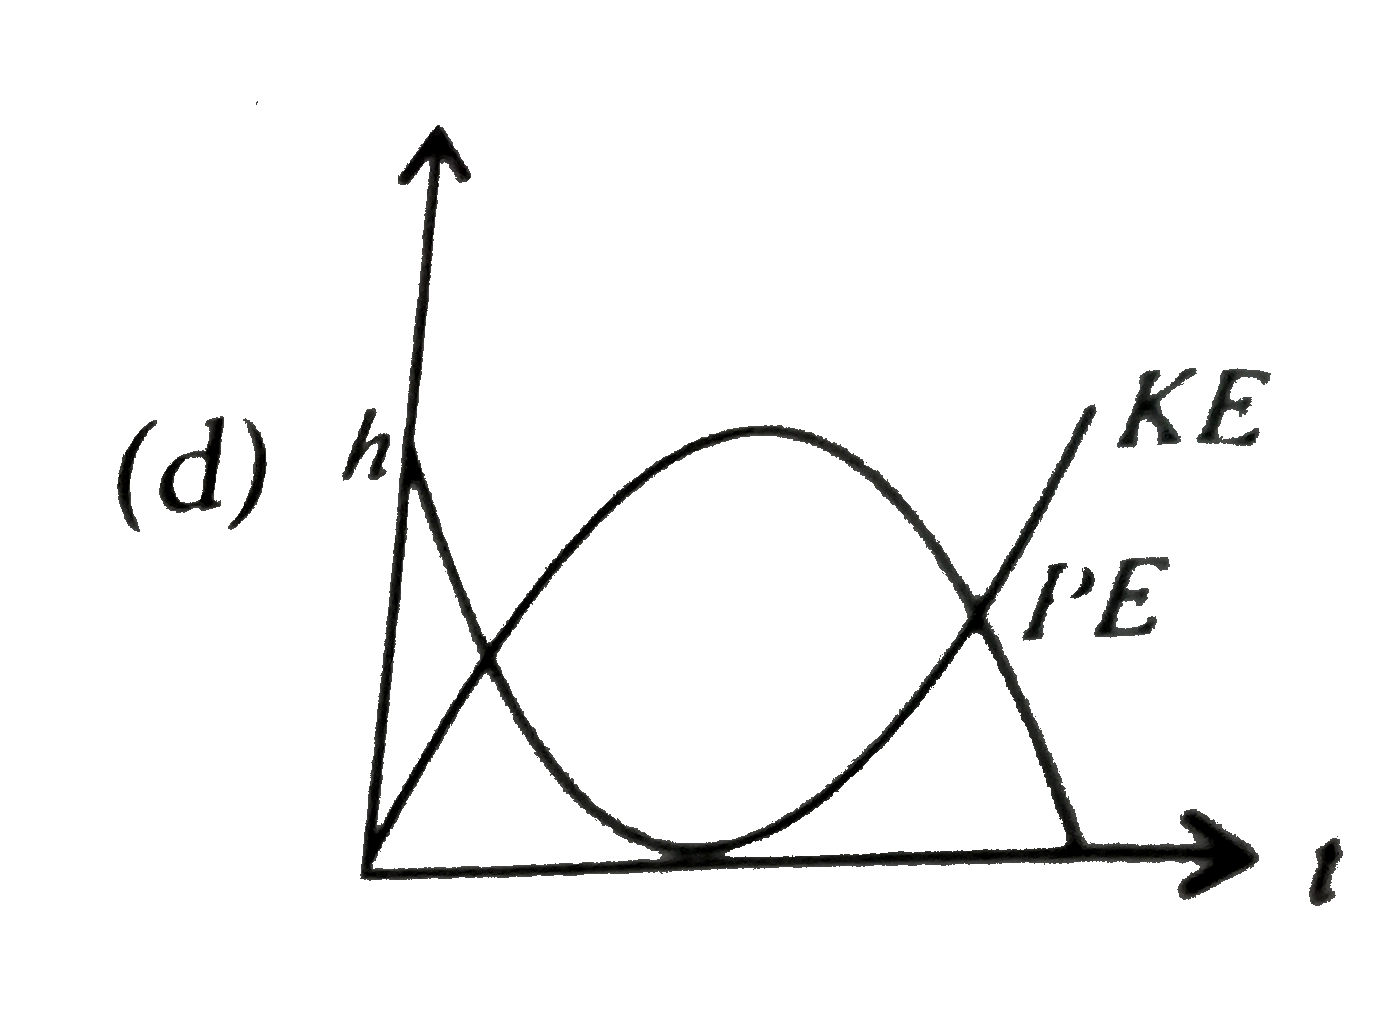
The kinetic energy of a body moving along a straight line varies with time as shown in figure. The force acting on the body:
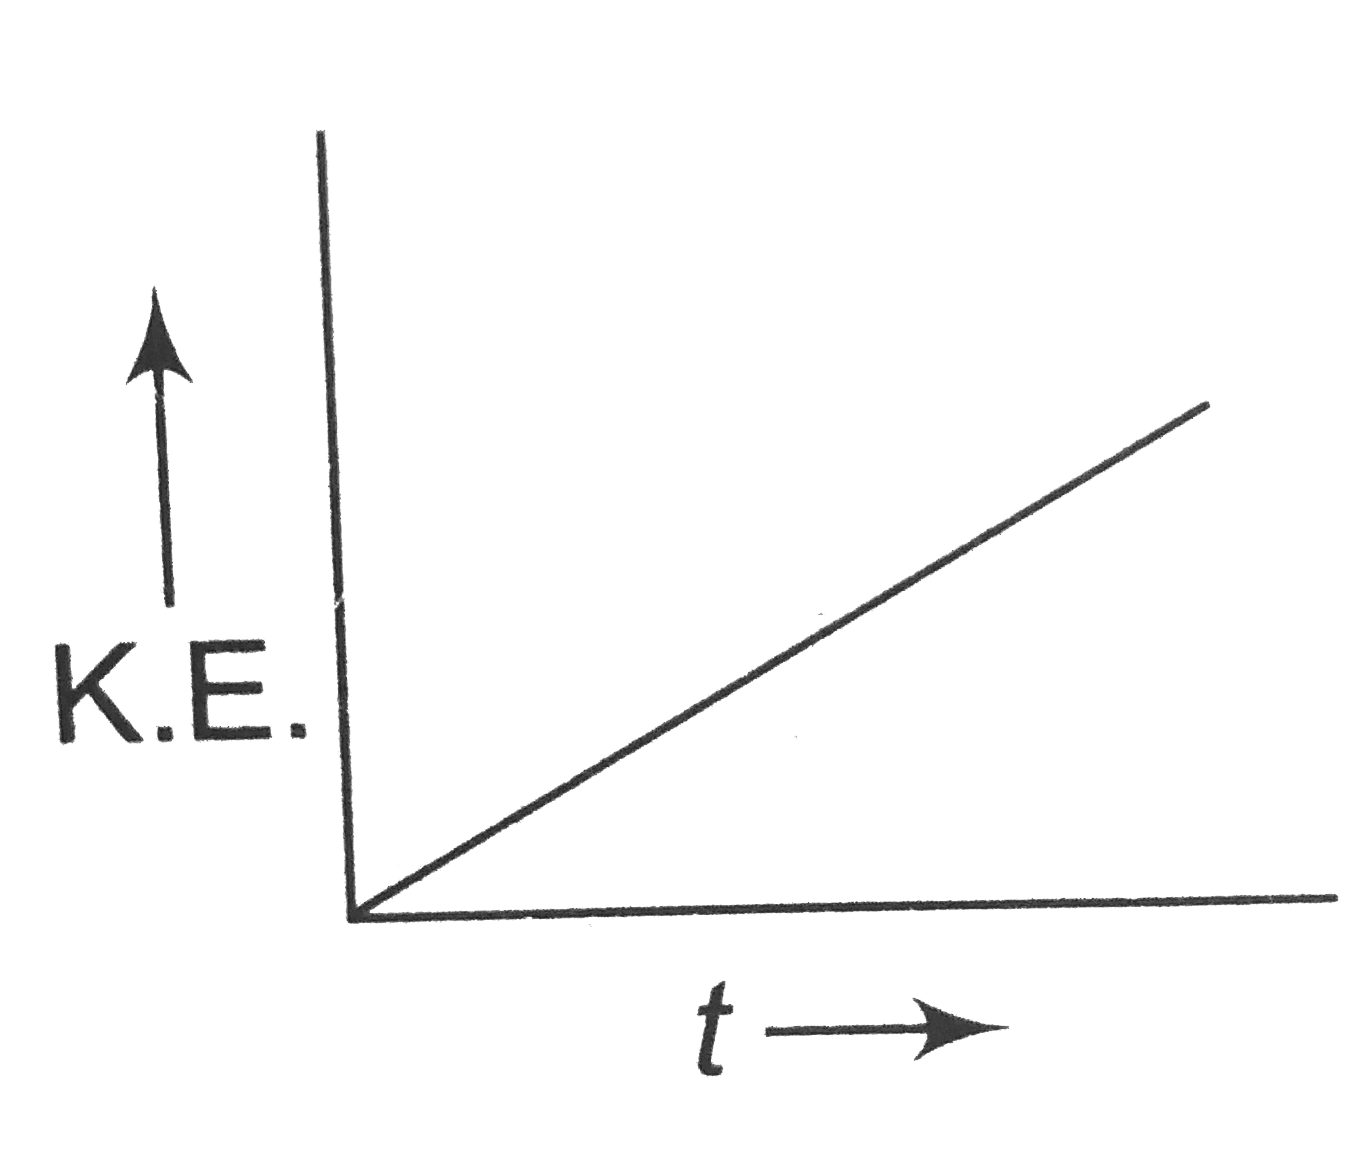
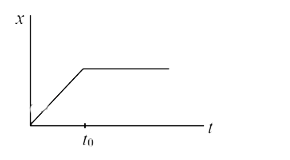
View SolutionFigure shows the position-time graph of a particle moving on the X--axis. Which of these option correctly describes the particle 's motion?
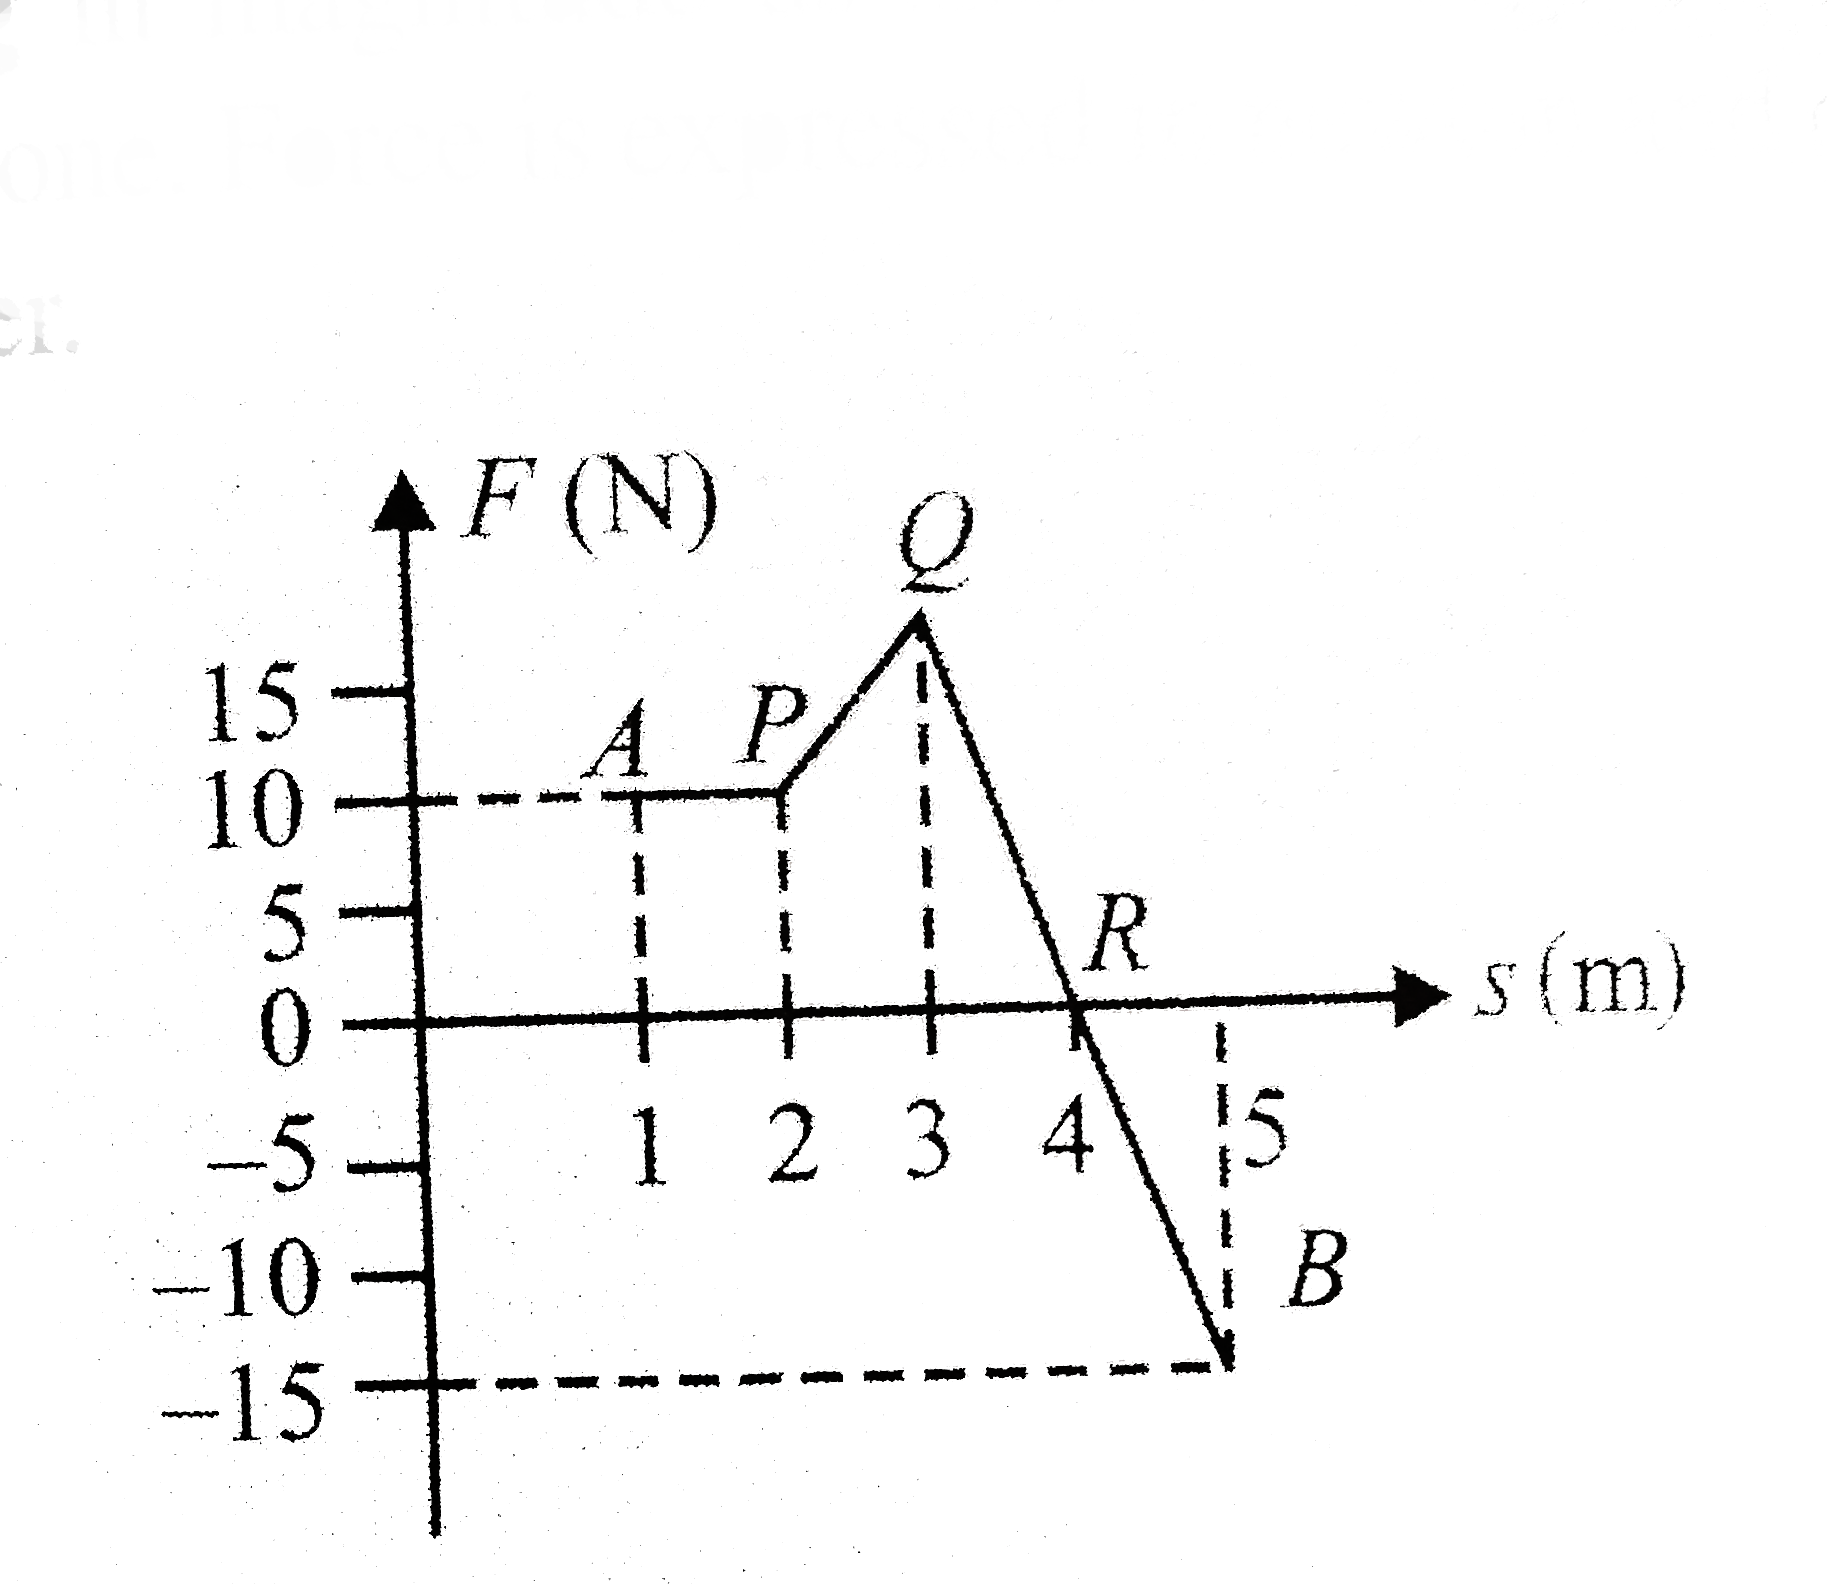
View SolutionA particle moves in one dimension from rest under the influence of a force that varies with the distance travelled by the particle as shown in the figure. The kinetic energy of the particle after it has travelled 3m is:
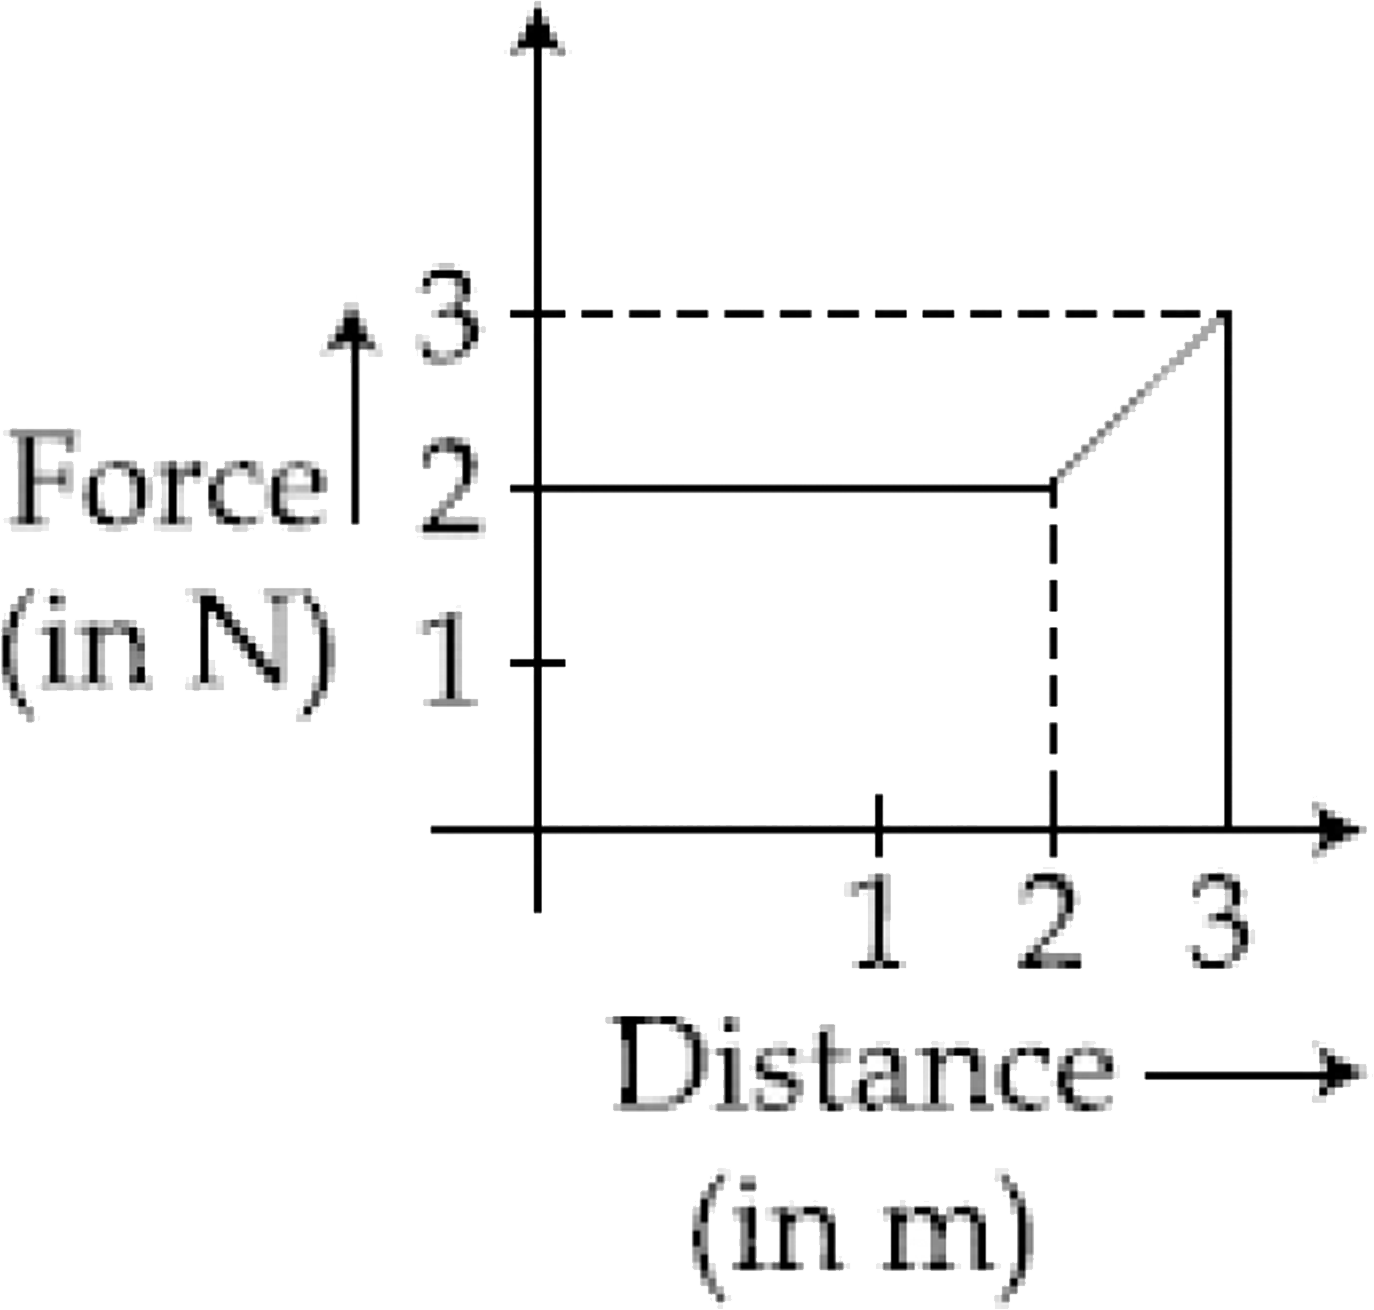
View SolutionA body moves from point A to B under the action of a force, varying in magnitude as shown in figure. Obtain the work done. Force is expressed in newton and displacement in meter.
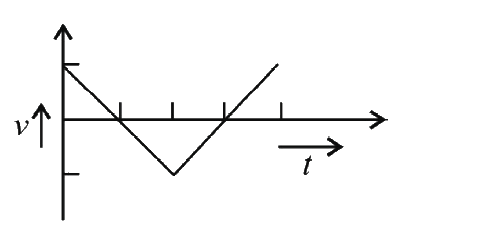
View SolutionThe graph in figure shows the velocity v versus time t for a body. Which of the graphs shown in figure represents the correesponding acceleration versus time graphs ?
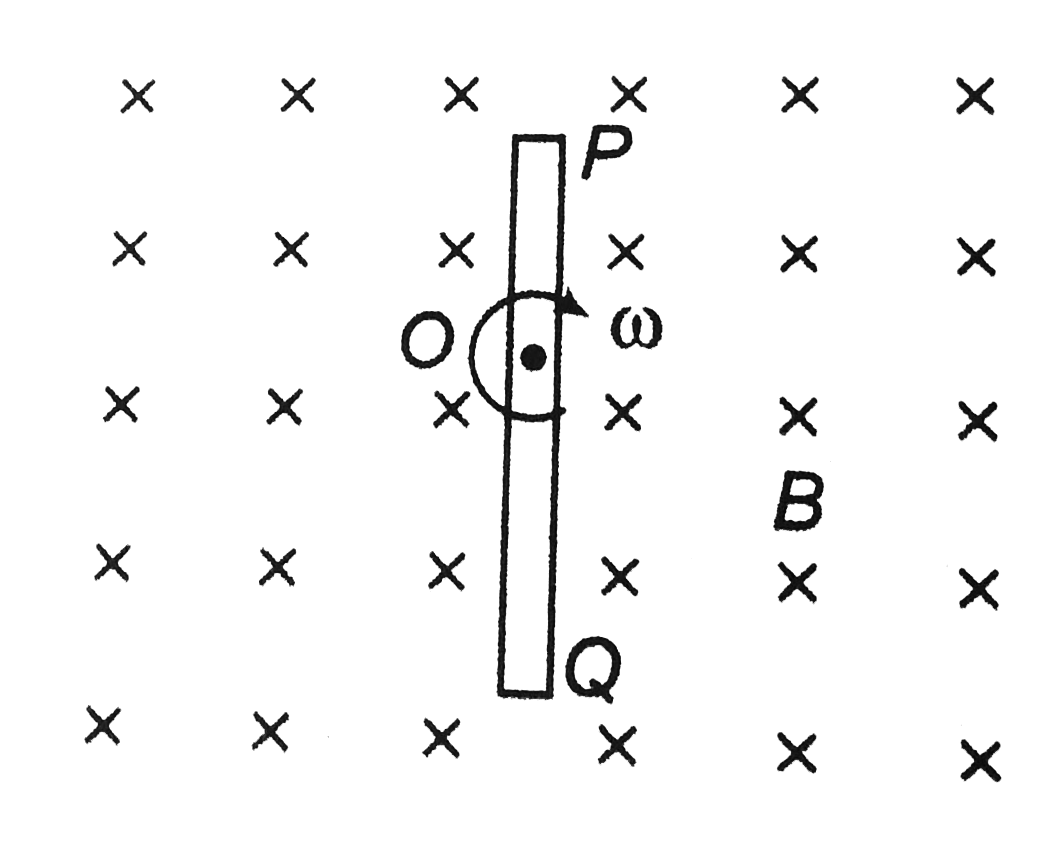
View SolutionA rod is rotating with a constant angular velocity ω about point O (its centre) in a magnetic field B as shown. Which of the folloiwng figure correctly shows the distribution of charge inside the rod?
View SolutionA particle of mass m starts moving from origin along a horizontal x-y plane under the influence of a force of constant magnitude F ( which is always parallel to the x-axis ) and a constraint force. The trajectory of its motion is f(x)=xx2+1. Then,
View Solution
