The graphs in (i) and (ii) show the S-t graph and V -t graph of a body. Are the motions shown in the graphs represented by OAB the same ?
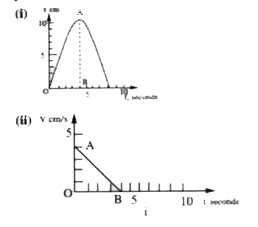
The motion shown by the two graphs are not same.
i) In the given s-t graph OA,is a uniform retardation motion.
Here,displacement=(average velocity)×(time)
∴10=u+02×4∴u=5ms−1
using v2−u2=2as
0−52=2a(10)
a=−1.25ms−2
ii)In the given V-t graph,
OA is a uniform retardation of motion
a=slope of the line =OAOB=−4ms−14s=−1ms−2
Thus the two graphs even though represent uniform retadation motions,the magnitudes are not equal.
Similar Questions
Graph of a body is shown. It explains that
 View Solution
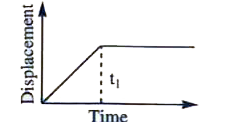
The x-t graph shown in figure represents.
 View Solution
The x-t graph shown in figure represents
 View Solution
s-t graph of a particle in motion is shown in Fig. Calculate
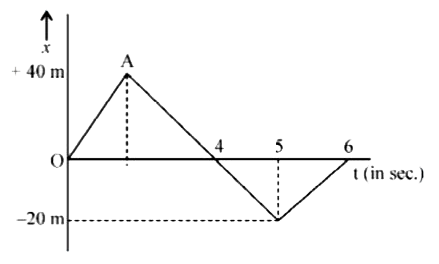
Average speedView Solutions-t graph of a particle in motion is shown in Fig. Calculate
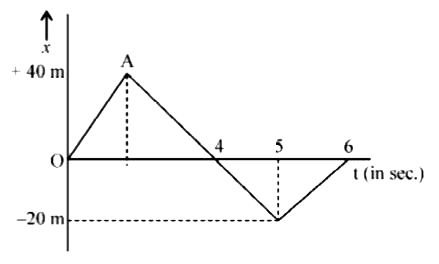
DisplacementView Solutions-t graph of a particle in motion is shown in Fig. Calculate
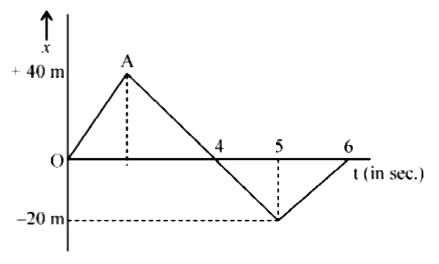
Total covered distanceView Solutions-t graph of a particle in motion is shown in Fig. Calculate Average velocity
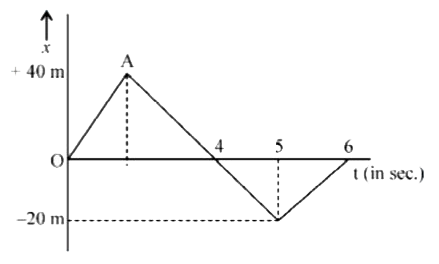
View SolutionThe velocity-time graph of a body is shown in .
The displacement of the body in 8s is.
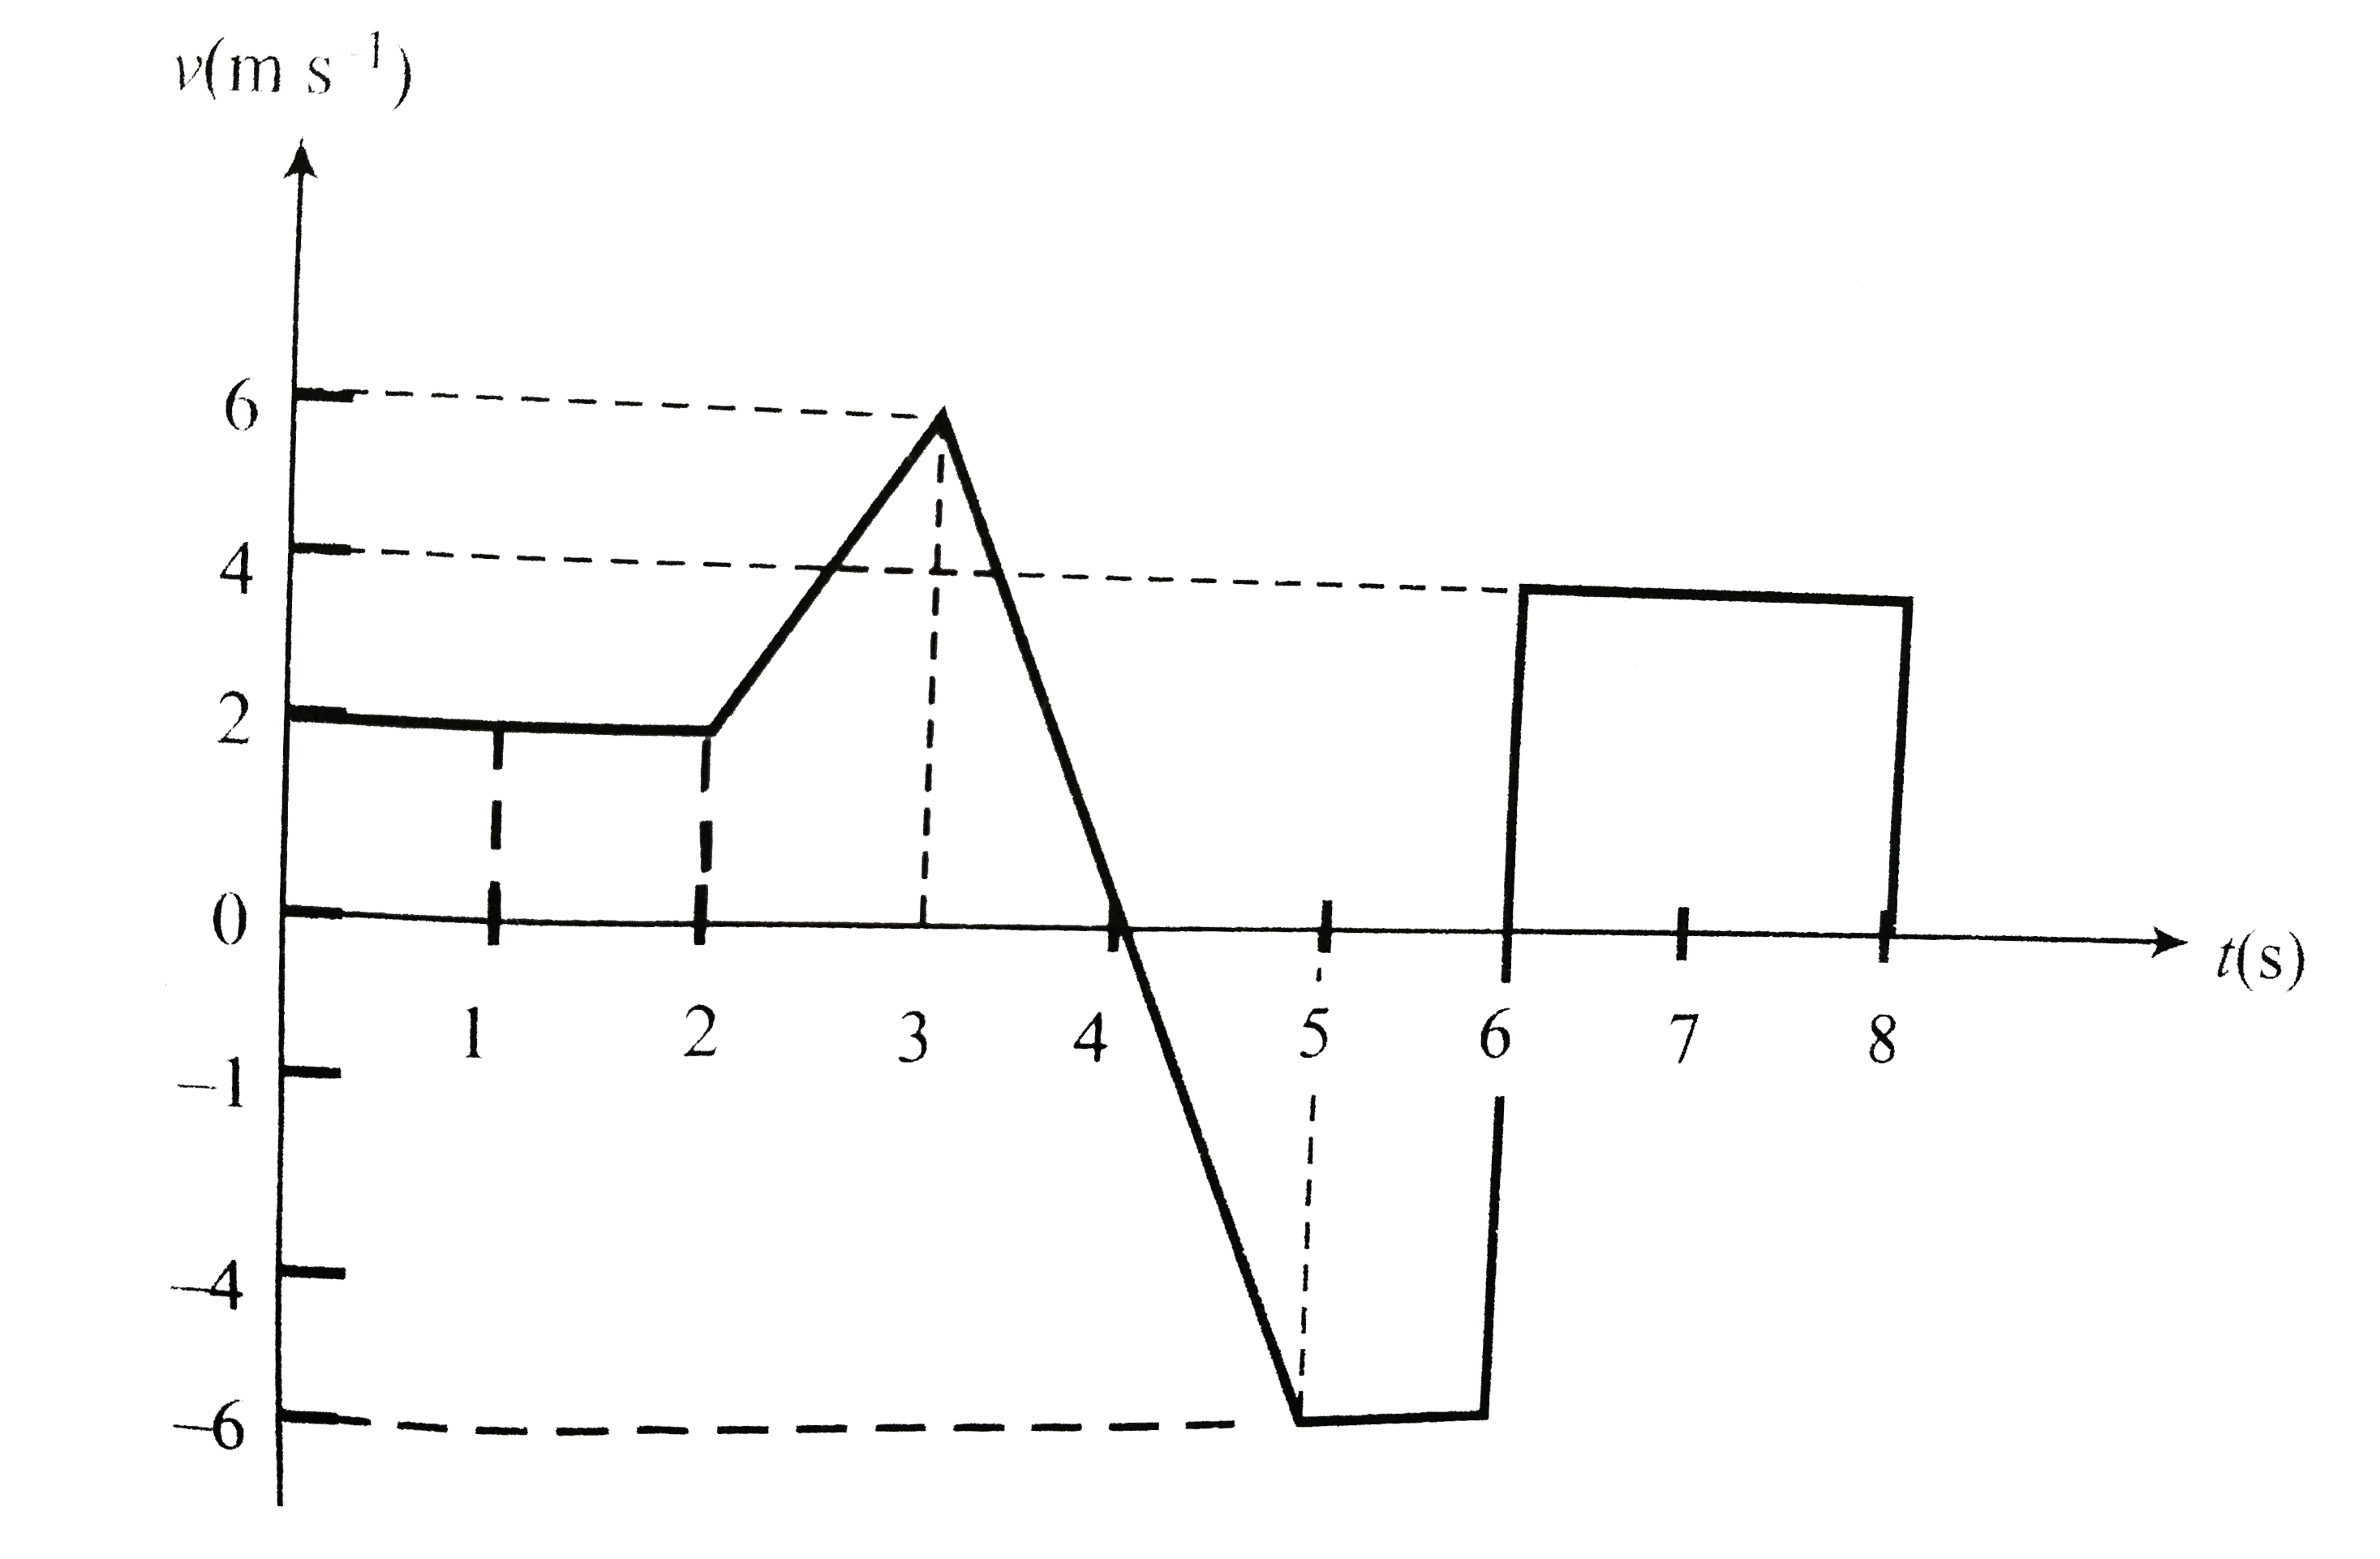 .View Solution
Draw the x-t graph of an object in uniform motion.
View SolutionThe graph in figure shows the velocity v versus time t for a body. Which of the graphs shown in figure represents the correesponding acceleration versus time graphs ?
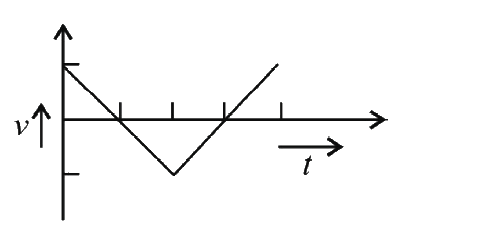 View Solution
