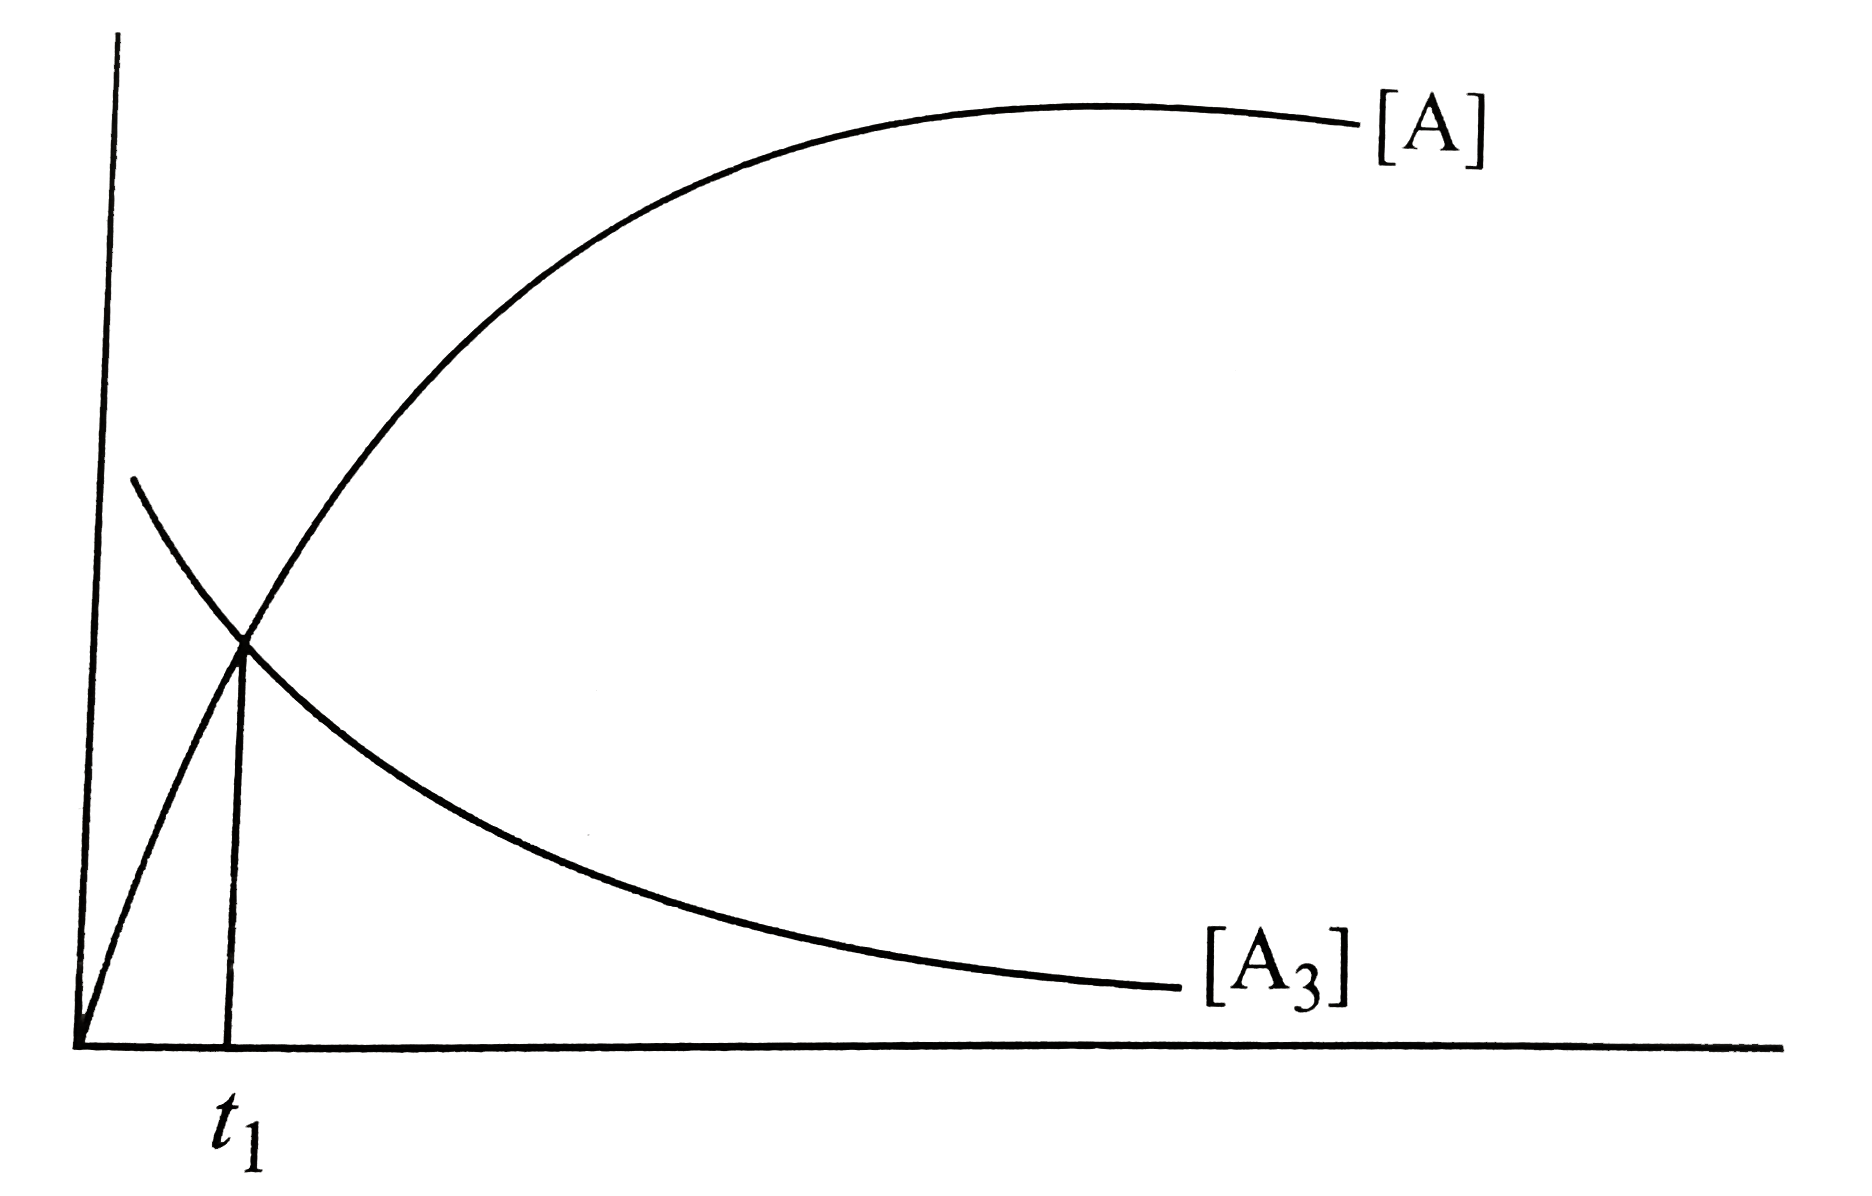
Using the given graph showing concentration of reactants and Products as a function of times for the reaction:
A3→3A
The time t1 corresponds to
 Solution in Kannada
t1/2
t1/3
t1/4
t1/5
The correct Answer is:C
Similar Questions
The following graph shows how t_(1//2) (half-life) of a reactant R changes with the initial reactant concentration a_(0) . The order of reaction will be
View SolutionDrawn the graphs that relate the concentrations (C ) of the reactants and the reaction times (t) and the concentrations of the products(C ) and the reaction times (t) in chemical reactions .
View SolutionWhat will be the nature of the graph showing the concentration of the reactant and time of a first order reaction ?
View SolutionPlot a graph of concentration of a reactant at time t, [ (a-x)] against time for a first order reaction .Here a = initial concentration of the reactant an x = change in concentration of the reactant at any time 1 during the reaction.
View SolutionGive relation between half reaction time (t1/2) and initial concentration of reactant for (n−1) order reaction
View SolutionThe following graph shows how T1/2 (half-life) of a reactant R changes with the initial reactant concentration a0.

The order of the reaction will be:
View SolutionFor a reaction 3A rarr Products, it is found that the rate of reaction doubles. If the concentration of A is increased four times, calculated the order of reaction.
View SolutionUsing the given graph showing concentration of reactants and Products as a function of times for the reaction: A_(3) rarr 3A The time t_(1) corresponds to
View Solution

