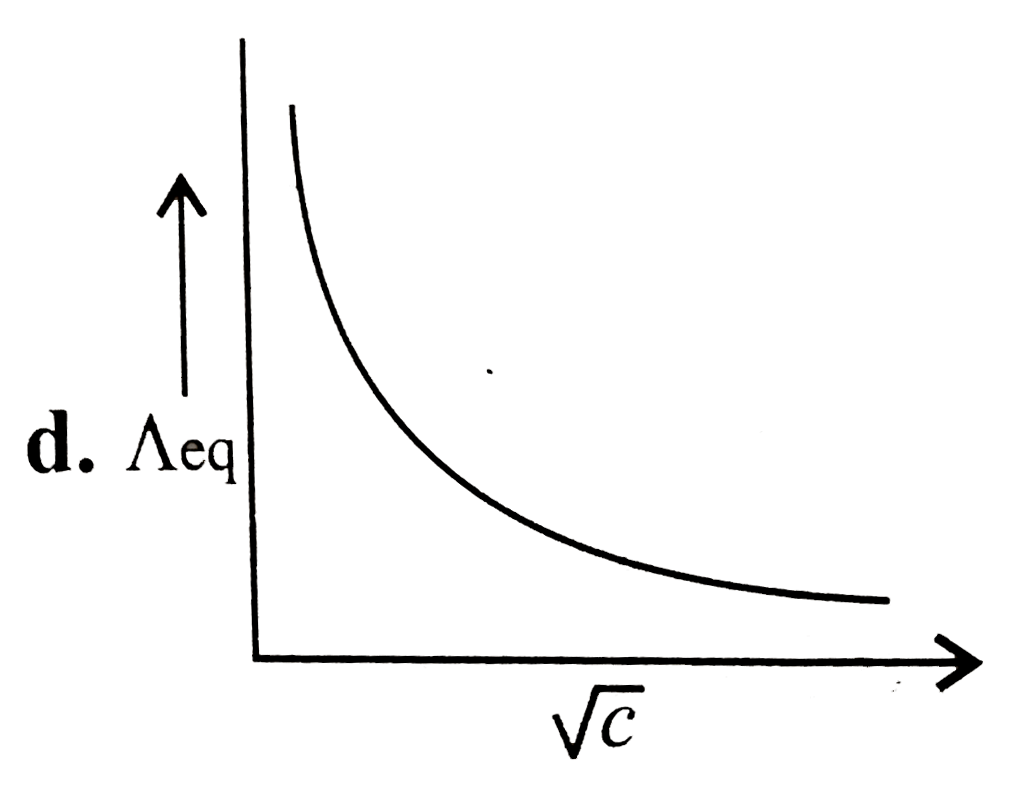
The variation equivalent conductance of stronge electrolyte with √Concentration is correctly shown in the figure. Solution in Kannada


The correct Answer is:b
λvs.√c curves are linear for strong electrolytes following Huckel − Onsagar equation.
Similar Questions
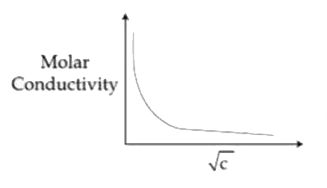
The variation of molar conductivity wih concentration of an electrolyte (X) in aqueous solution is shown in the given figure .

The electrolyte X is :02:37View SolutionWhich of the following plots correctly represents variation of equivalent conductance (∧eq) with dilution for a strong electrolyte ?
View SolutionExplain the different behavior of strong and weak electrolytes towards the variation of conductivity with concentration?
04:29View SolutionDefine molar conductivity of an electrolytic solution
Show the variation of molar conductivity of a strong electrolyte with square root of concentration.06:32View SolutionFor a dilute solution of a strong electrolyte, the variation of molar conductivity with concentration is given by
01:42View SolutionThe variation equivalent conductance of stronge electrolyte with √Concentration is correctly shown in the figure.
02:25View SolutionThe variation equivalent conductance of stronge electrolyte with sqrt(Concentration) is correctly shown in the figure.
03:32View SolutionThe equivalent conductance of strong electrolyte:
02:33View Solution
