This question is to be answered on the basis of the pie chart given below showing how a person's monthly salary is distributed over different expanse heads
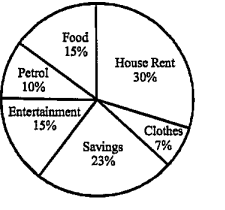
The percentage of money spent on clothes and savings is equal to which other single item of expenses?
petrol
house rent
food
entertainment
The correct Answer is:B
Step by step video & image solution for This question is to be answered on the basis of the pie chart given below showing how a person's monthly salary is distributed over different expanse heads The percentage of money spent on clothes and savings is equal to which other single item of expenses? by Maths experts to help you in doubts & scoring excellent marks in Class 14 exams.
Updated on:21/07/2023Similar Questions
This question is to be answered on the basis of the pie chart given below showing how a person's monthly salary is distributed over different expanse heads
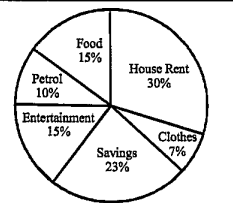
The angle made at the centre of the pie chart by the sector representing the expanse on petrol is
View SolutionThe expenses of a country for a particular year is given in Pie-Chart. Read the Pie-Chart and answer the questions.
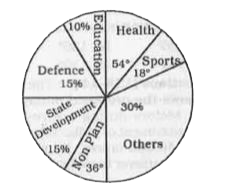
The percent of excess money spent on Others than that on Sport is
View Solution
Knowledge Check
The pie chart given below shows the expenses incurred and saving by a family in a month. What is the percentage of expenses incurred on account of recreation ?
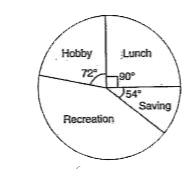 A80017%B20%C35%D40%
The pie chart given below shows the monthly expenses on various heads of a family . The total expenditure of the family is Rs 30000.
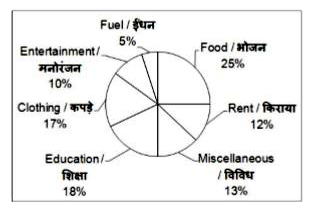
What is the amount (in Rs) spent on food ?A2500B5000C7500D8000The pie chart given below shows the monthly expenses on various heads of a family . The total expenditure of the family is Rs 30000.
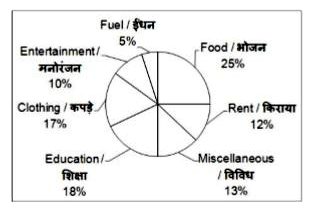
What is the total amount (in Rs) spent on fuel and education ?A6900B7100C5700D6300
The pie chart shyows how the school funds is spent under different heads in a certain school. Using the pie chart answer the questions.
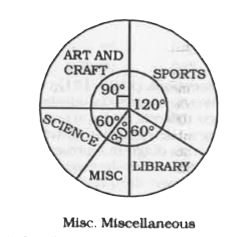
Which head uses 25% of the funds?
View SolutionThe pie chart shyows how the school funds is spent under different heads in a certain school. Using the pie chart answer the questions.
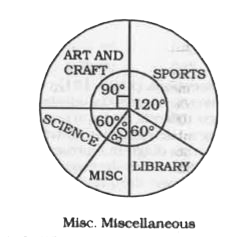
Which head has the maximum expenditure?
View SolutionThe pie chart shyows how the school funds is spent under different heads in a certain school. Using the pie chart answer the questions.
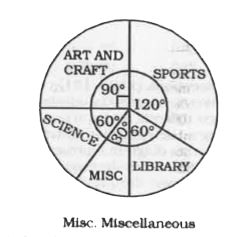
Which heads have the same amount of expenditure?
View SolutionThe bar graph given below shows the spending of a family income on various items and savings during 1993. Observe the graph and answer the following questions :
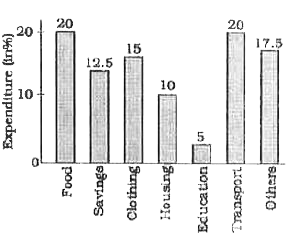
The percent of income spent on clothing exceeds that on savings by :
View SolutionThe pie chart shyows how the school funds is spent under different heads in a certain school. Using the pie chart answer the questions.
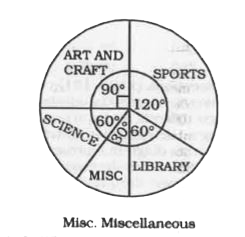
What percentage of the total expense is spent on library?
View Solution
