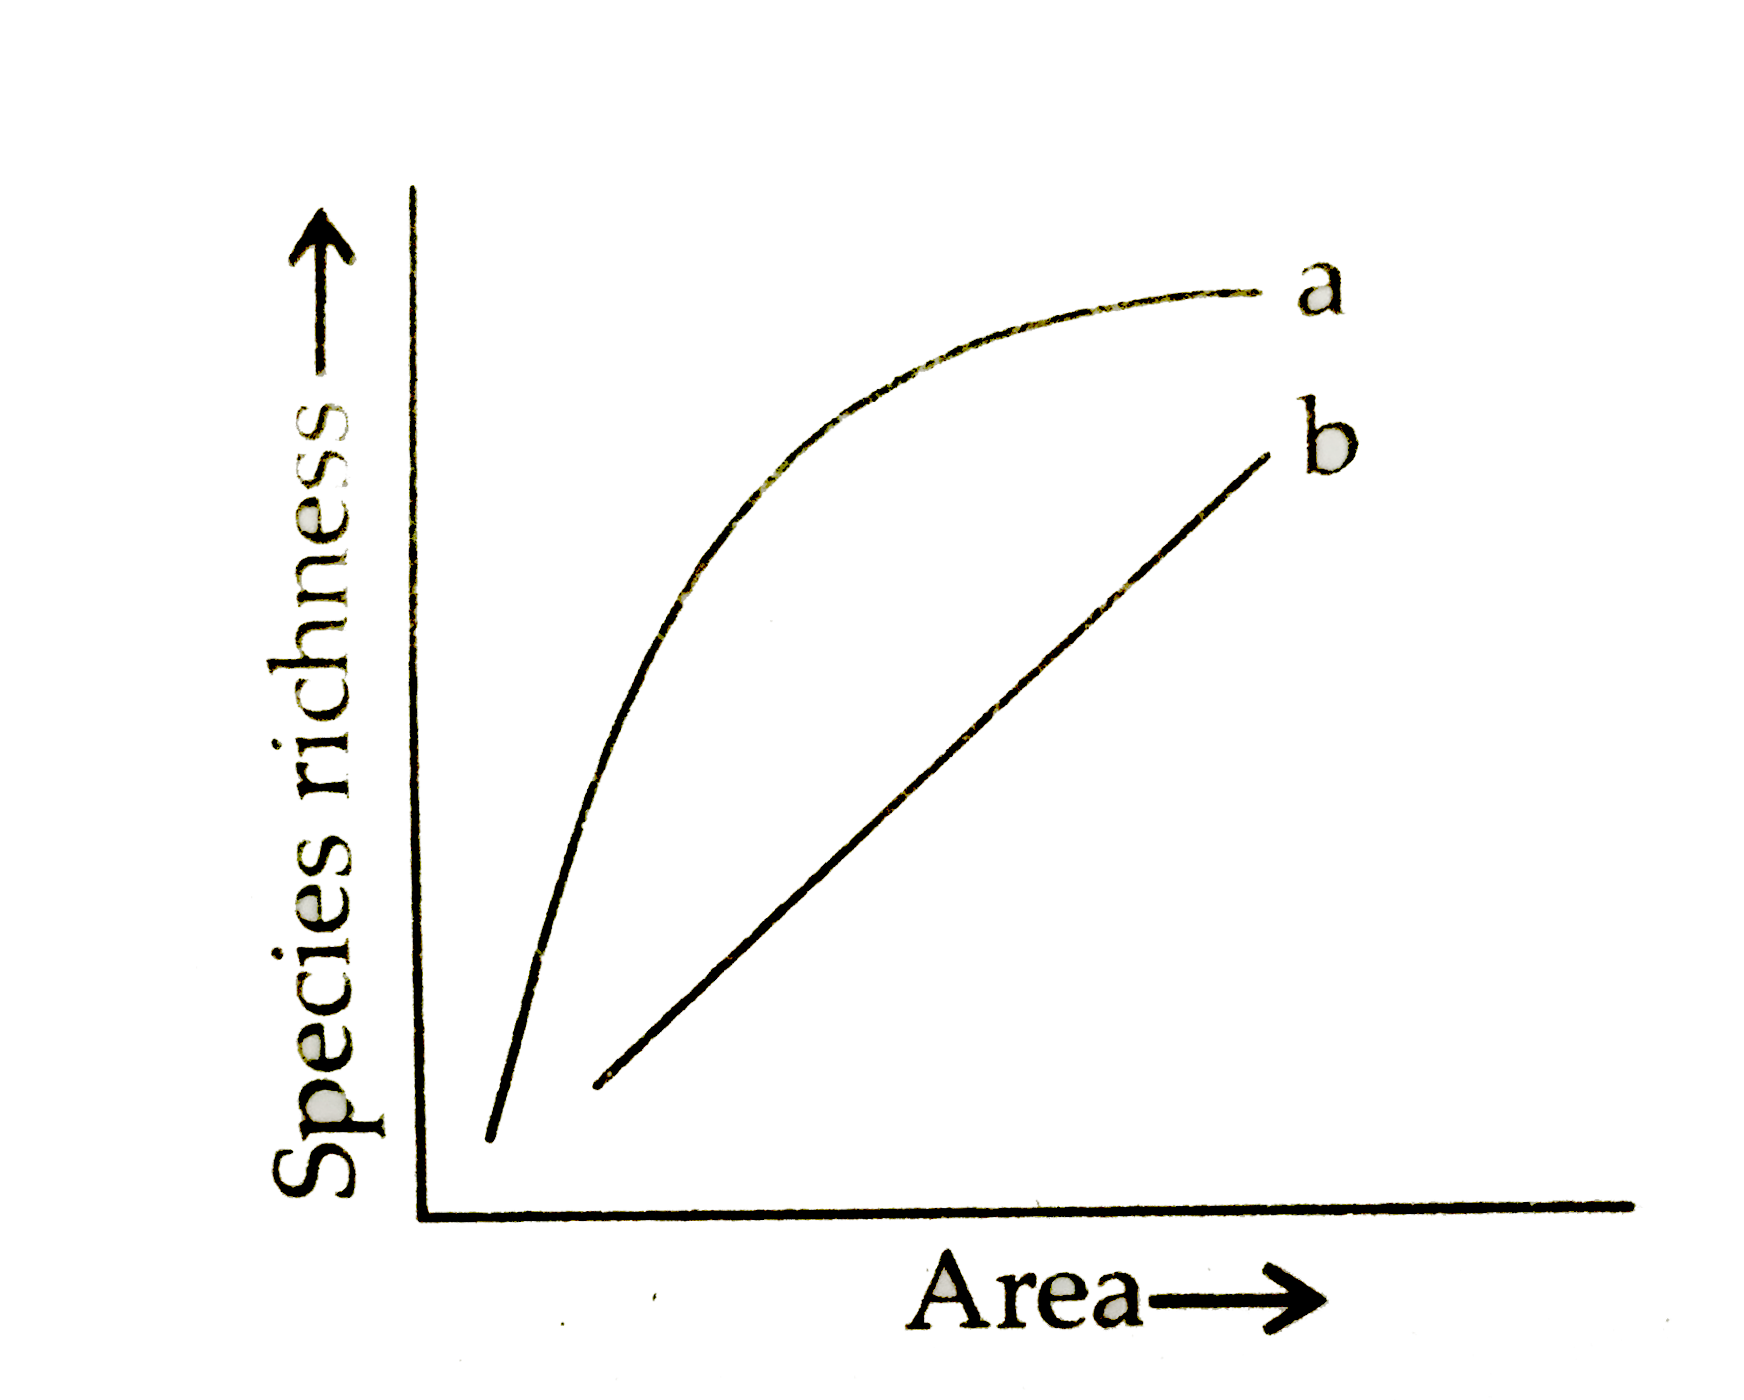
Which option correctly describes the equations for curves A and B, in the given graph of species-area relationship?
 Solution in Odia
ABS=CAzLogS=LogC+ZLogA
ABLogS=LogC+ZLogAS=CAz
ABLogC=LogS+ZLogAS=CAz
ABS=CAzLogC=LogS+ZLogA
The correct Answer is:A
Step by step video & image solution for Which option correctly describes the equations for curves A and B, in the given graph of species-area relationship? by Biology experts to help you in doubts & scoring excellent marks in Class 12 exams.
Updated on:21/07/2023Similar Questions
The above graph show Species-Area relationship. Write the equation of the curve a and explain.

View SolutionDescribe species area relationships.
View Solutionनिम्नलिखित में से कौनसा दिये गये ग्राफ का सही वर्णन करता है?

View SolutionWhich of the following describes the given graph correctly ?

View SolutionThe graph shows species area relationship. If b denotes the relationship on log scale. Describe a and b .
View SolutionWhich of the following equation correctly represent species-area relationship?
View SolutionRelationship between species richness (S) and area (A) represent in the following graph is described by the equation
View SolutionWhich of the following describes the given graph correctly?
View Solution
