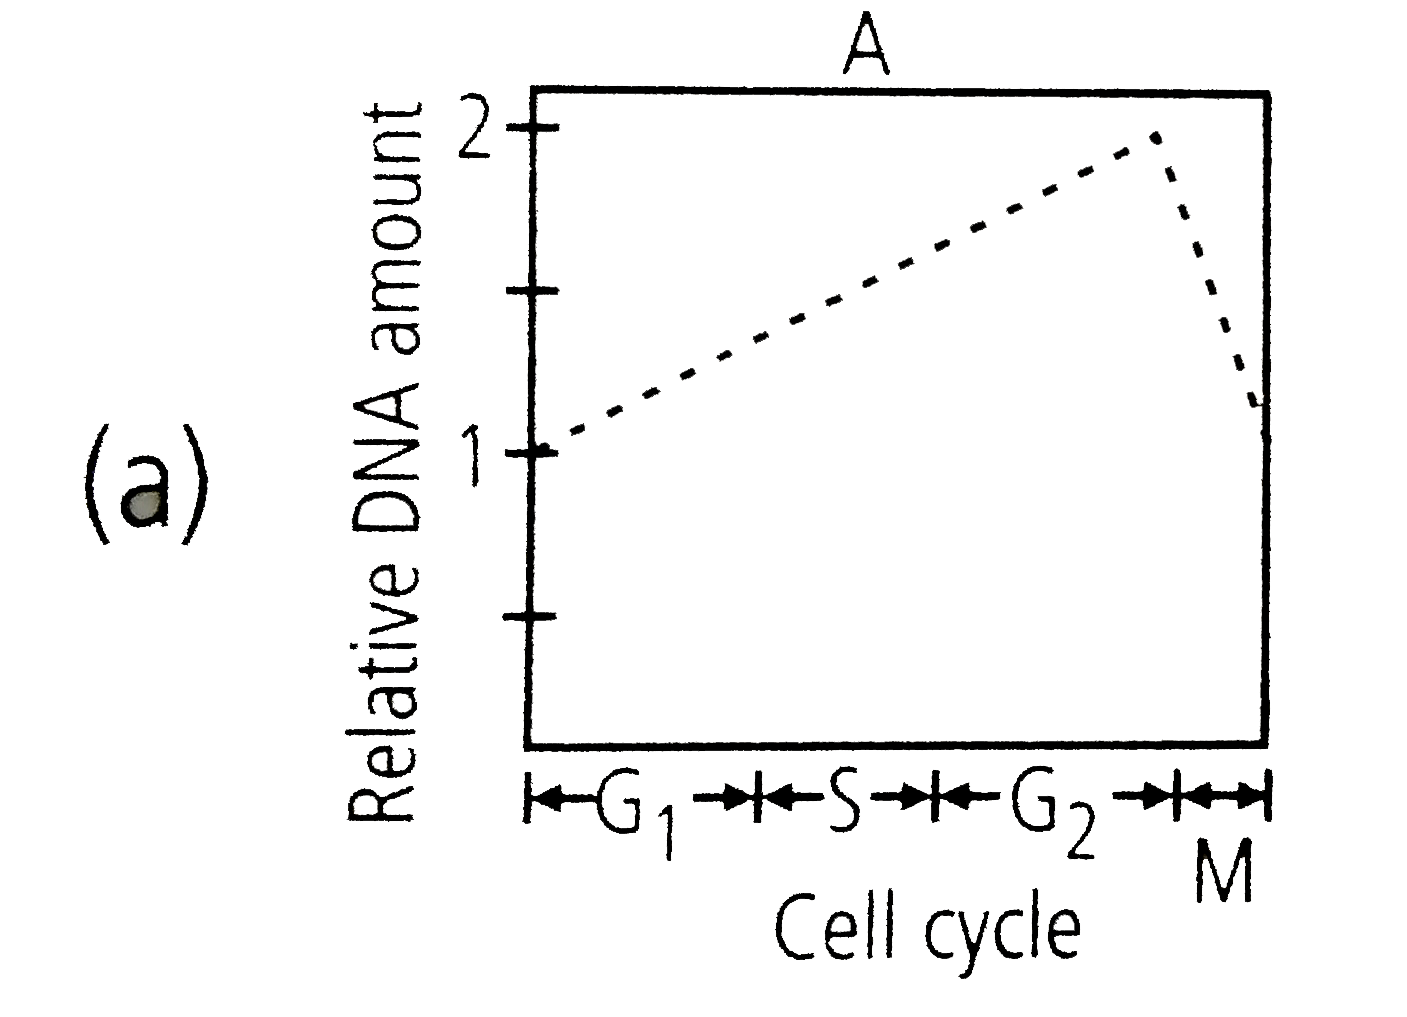
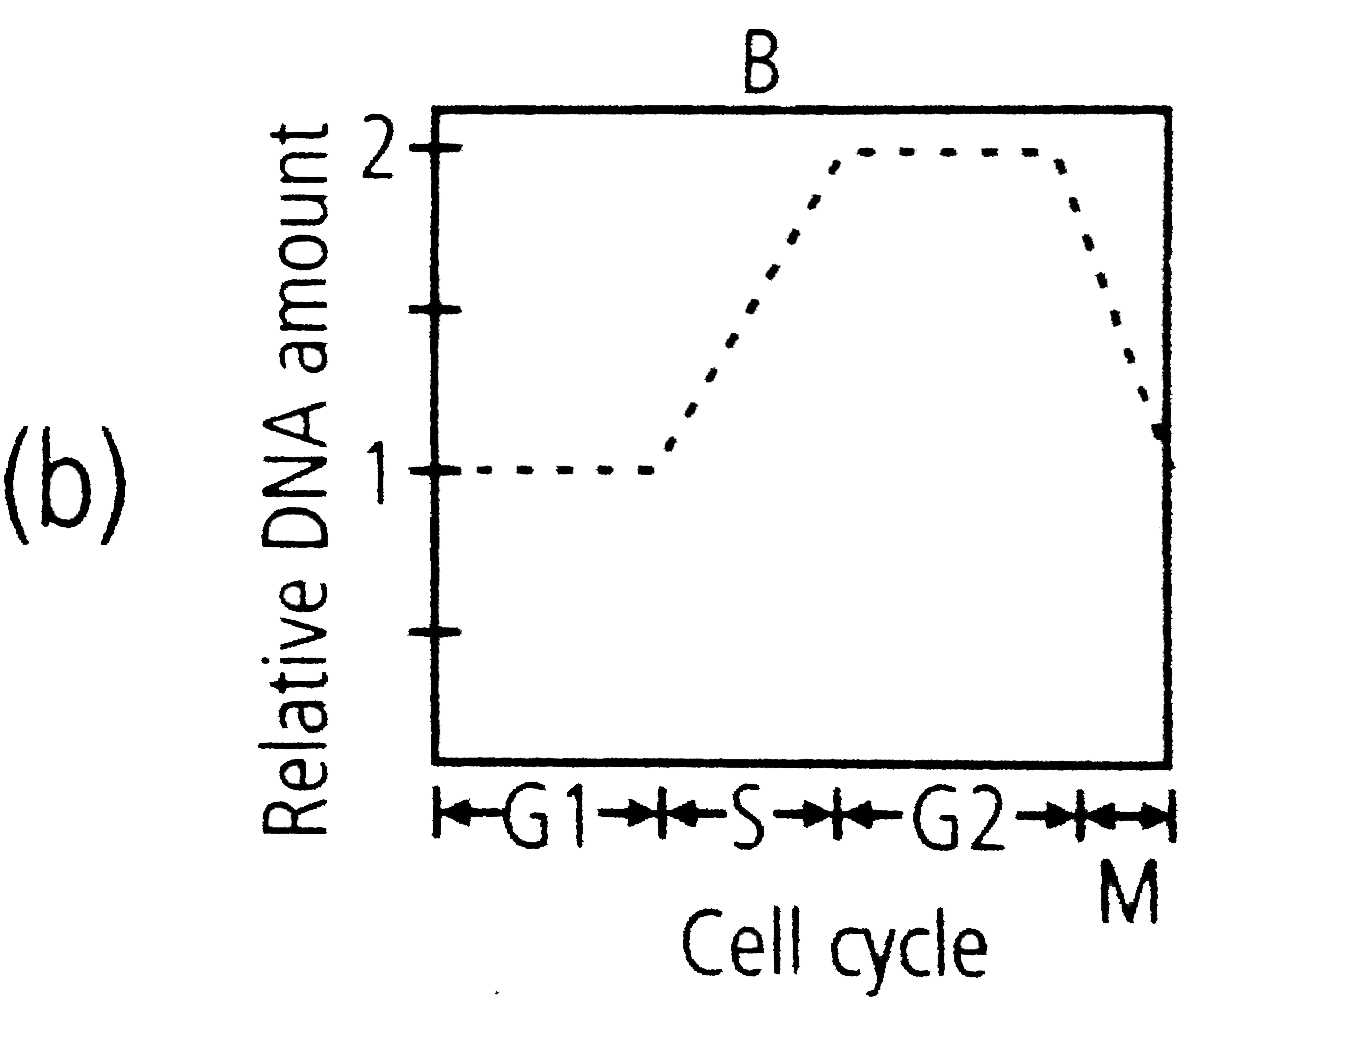
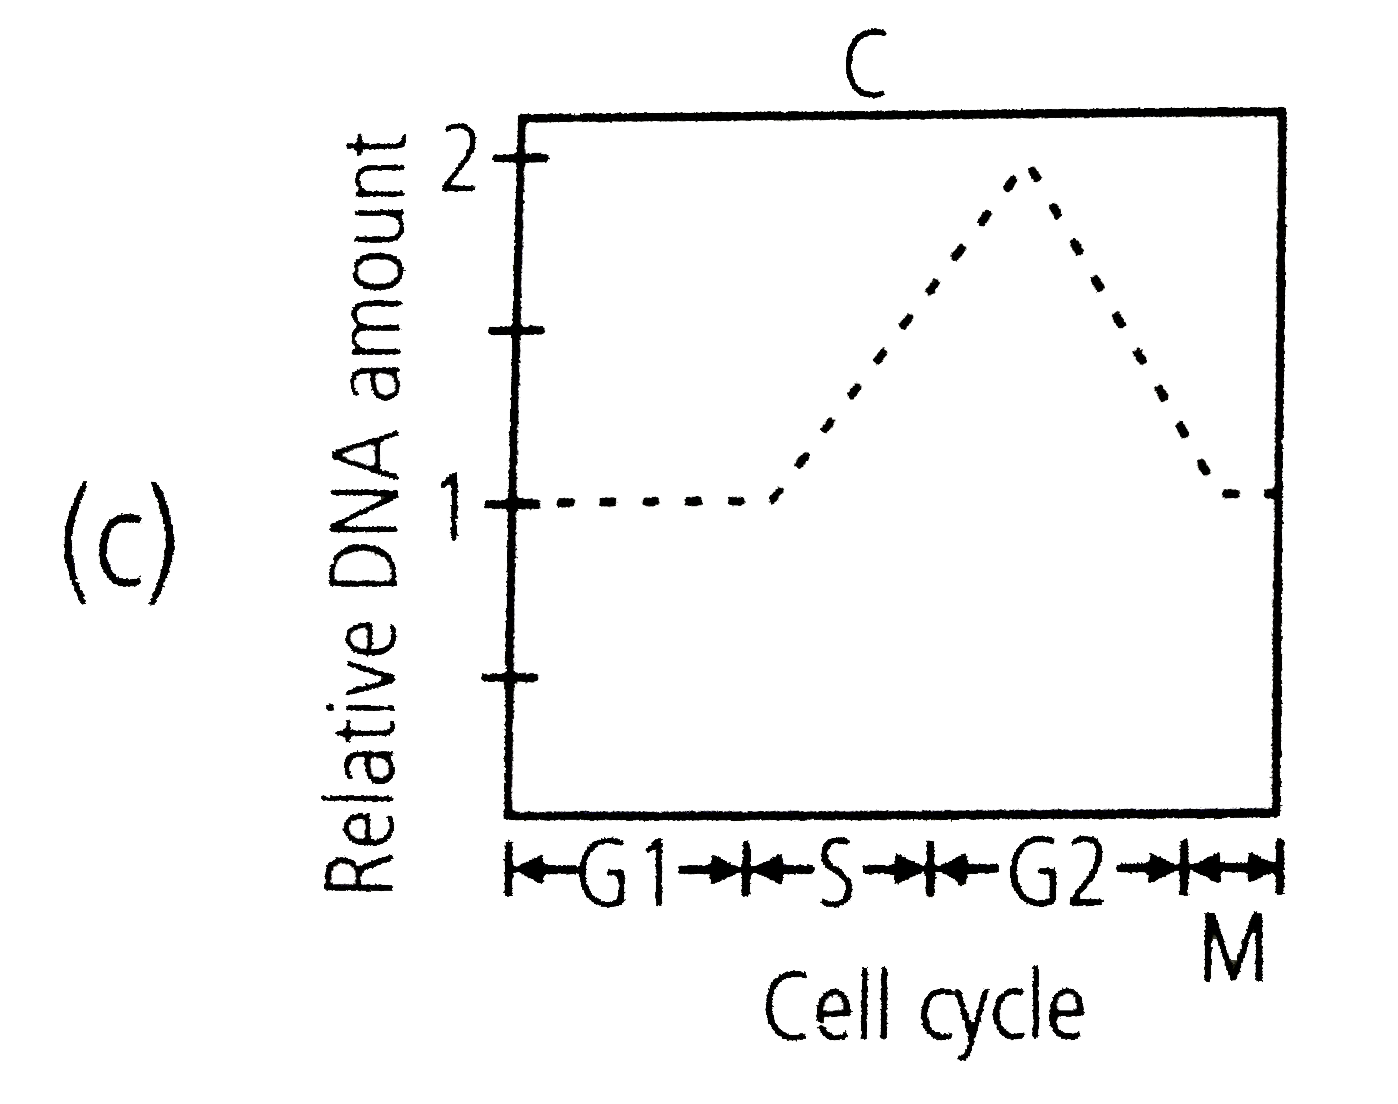
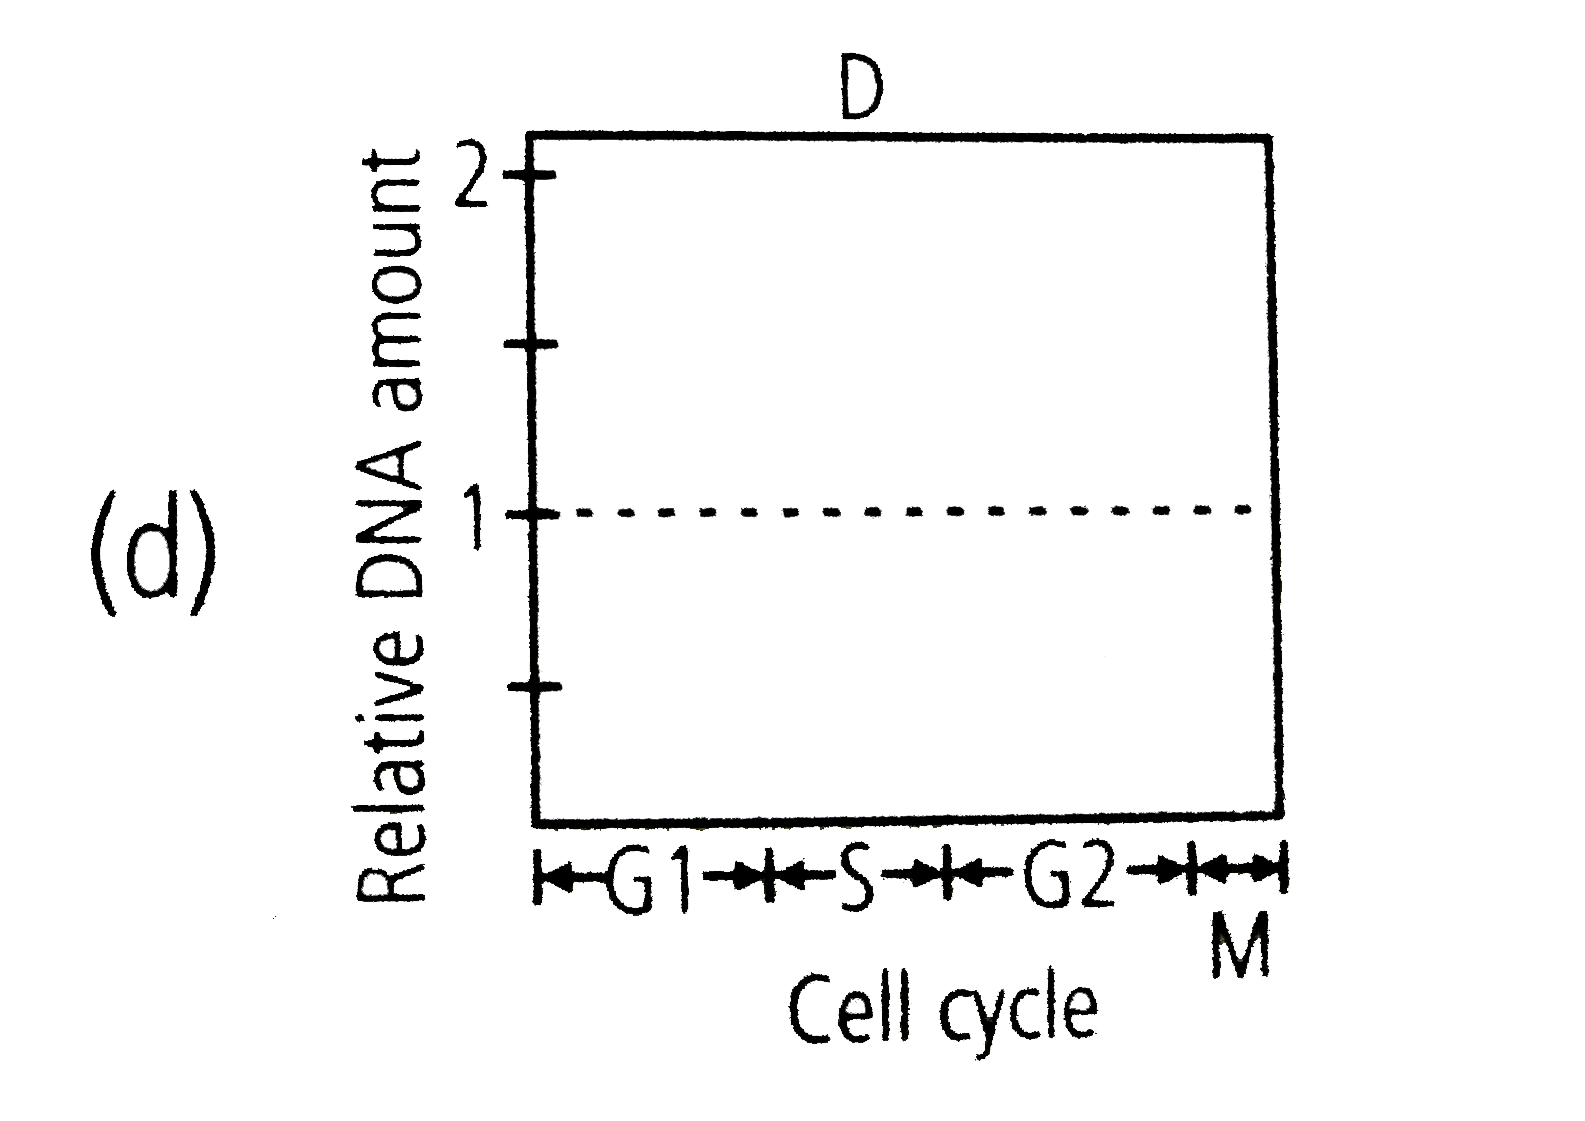
Which of the following graphs shows the relative change in the amount of mitochondrial DNA of a cell undergoing mitosis? Solution in Odia
A

B

C

D

Video Solution
Text Solution
The correct Answer is:A
Mitochondrion has its own replication cycle. Completely separate from the cell in which if resides.
|
Similar Questions
Mitochondrial DNA is: -
View Solutionनिम्न को सुमेलित कीजिये :-
View SolutionWhich one of the following undergoes mitosis
View SolutionThe given graph shows the change in DNA content in a single cell during the mitosis which stage occurs between the time x and y ?
View SolutionName a few conditions when cells undergo mitosis.
View SolutionA cell having 2n = 20, chromosomes with 2C amount of DNA, is undergoing mitosis, what will be the number of chromosomes and amount of DNA during G1 S and G2 phases respectively?
View SolutionTypically, cells that no longer undergo mitosis have chromosomes with ___ molecule of DNA and they remain in the ____ subphase of interphase-
View Solution
The above graph shows the change In DNA content during various phases (A to (d) in a typical mitotic cell cycle. Identify the phases

View Solution
