The bar graph given below presents the number of books sold by a bookseller during different months of a year.
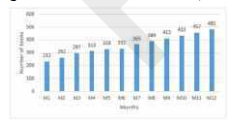 The number of books sold in month M3 is what percent of books sold in month M6?
89.45%
92.45%
95.45%
98.45%
The correct Answer is:A
Step by step video & text solution for The bar graph given below presents the number of books sold by a bookseller during different months of a year. The number of books sold in month M3 is what percent of books sold in month M6? by Maths experts to help you in doubts & scoring excellent marks in Class 14 exams.
Updated on:21/07/2023Similar Questions
The bar graph given below presents the number of books sold by a bookseller during different months of a year.
नीचे दिया गया दंड आरेख एक पुस्तक विक्रेता के द्वारा किसी वर्ष के अलग-अलग महीनों में बेची गयी पुस्तकों की संख्या को दर्शाता है | The number of books sold in month M3 is what percent of books sold in month M6?
माह M3 में बेची गयी पुस्तकों की संख्या माह M6 में बेची गयी पुस्तकों की संख्या का कितना प्रतिशत है ?
View SolutionThe bar graph given below presents the number of books sold by a bookseller during different months of a year.
नीचे दिया गया दंड आरेख एक पुस्तक विक्रेता के द्वारा किसी वर्ष के अलग-अलग महीनों में बेची गयी पुस्तकों की संख्या को दर्शाता है |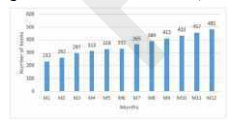
The number of books sold in month M8 is how much more than the average number of books sold per month?
माह M8 में बेची गयी पुस्तकों की संख्या प्रति माह बेची गयी पुस्तकों की औसत संख्या से कितना प्रतिशत अधिक है ?
View Solution
Knowledge Check
The Bar graph given below presents the number of books sold by a bookseller during different months of a year.
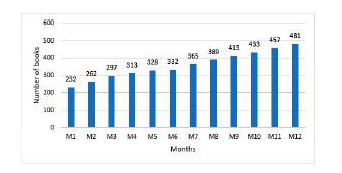
The number of books sold in month M8 is how much more than the average number of books sold per month?A34.5B22.5C30.5D26.5The Bar graph given below presents the number of books sold by a bookseller during different months of a year.
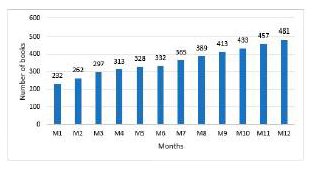
What is the total number of books sold by the bookseller in the year?A4032B4132C4302D4202
The bar graph given below presents the number of books sold by a bookseller during different months of a year.
नीचे दिया गया दंड आरेख एक पुस्तक विक्रेता के द्वारा किसी वर्ष के अलग-अलग महीनों में बेची गयी पुस्तकों की संख्या को दर्शाता है |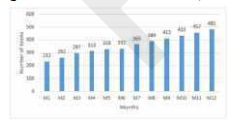 What is the total number of books sold by the bookseller in the year?
वर्ष में इस पुस्तक विक्रेता के द्वारा बेची गयी पुस्तकों की संख्या कुल कितनी है ?
View SolutionRead the bar graph which shows the number of books sold by a bookstore during five consecutive years and answer the following questions
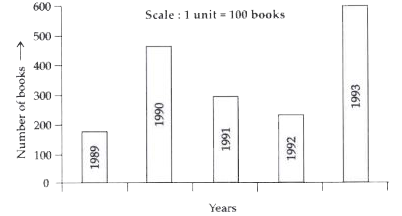
In which years were fewer than 200 books sold ?
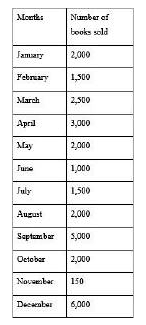
View SolutionThe number of books sold by a seller over a year is as follows. In which months did he sell more than the average number of books sold that year ?
View SolutionRead the bar graph which shows the number of books sold by a bookstore during five consecutive years and answer the following questions
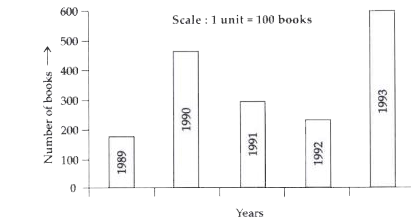
In which year highest books were sold ?
View SolutionRead the bar graph which shows the number of books sold by a bookstore during five consecutive years and answer the following questions
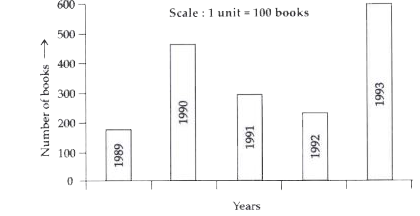
Can you give an appropriate name to the bar graph shown above ?
View SolutionThe data given below shows the number motorcycles of the same brand sold by two dealers in the first six months of a year
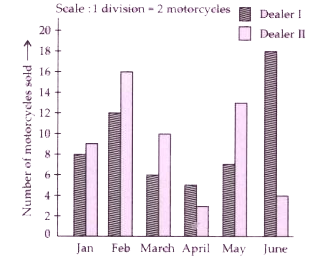
Find the total number of motorcycles sold by dealer II
View Solution
