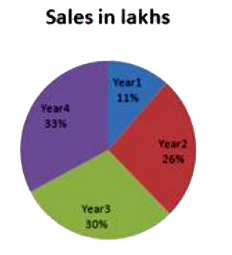
दिए गए पाई चार्ट का अध्ययन करें और निम्नलिखित प्रश्न का उत्तर दें। 4 वर्ष की कुल आय ₹ 75,00,000 है। वर्ष 2 से वर्ष 3 तक कुल आय कितनी है?

₹ 43,00,000
₹32.00.000
₹ 45,00,000
₹ 42,00,000
The correct Answer is:B
Step by step video, text & image solution for दिए गए पाई चार्ट का अध्ययन करें और निम्नलिखित प्रश्न का उत्तर दें। 4 वर्ष की कुल आय ₹ 75,00,000 है। वर्ष 2 से वर्ष 3 तक कुल आय कितनी है? by Maths experts to help you in doubts & scoring excellent marks in Class 14 exams.
Updated on:21/07/2023Similar Questions
The following line diagram represents the yearly sales figure of a company in the years 2001-2010. Examine the diagram and answer the question. निम्नलिखित रेखा आरेख किसी कंपनी की वर्ष 2007-2010 के दौरान वार्षिक बिक्री के आंकड़ों को दर्शाता है। आरेख का अध्ययन करें और नीचे दिए गए प्रश्नों के उत्तर दें- The ratio of sales in 2002 to that in 2007 is वर्ष 2002 में बिक्री का वर्ष 2007 में बिक्री के साथ अनुपात है-
View SolutionThe following line diagram represents the yearly sales figure of a company in the years 2001-2010. Examine the diagram and answer the question. निम्नलिखित रेखा आरेख किसी कंपनी की वर्ष 2007-2010 के दौरान वार्षिक बिक्री के आंकड़ों को दर्शाता है। आरेख का अध्ययन करें और नीचे दिए गए प्रश्नों के उत्तर दें- ............................................................................................................................................. Total sales (in crore of Rs.) from 2005 to 2008 is वर्ष 2005 से वर्ष 2008 तक कुल बिक्री (रु. करोड में) है-
View SolutionThe ratio of income of A and B last year was 4:3, respectively. The ratios of their individual incomes of the last year and the present year are 3:4 and 5:6, respectively. If their total income for the present year is Rs. 8.04 lakh, then the income of B last year was :
पिछले वर्ष A और B की आय का अनुपात क्रमशः 4 : 3 था | पिछले वर्ष और इस वर्ष की उनकी आय का अनुपात क्रमशः 3 :4 और 5 : 6 है | यदि वर्तमान वर्ष के लिए उनकी कुल आय 8.04 लाख रुपये है, तो पिछले वर्ष B की आय कितनी थी ?
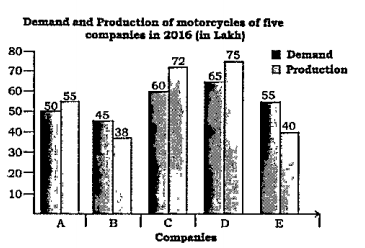
View SolutionStudy the following bar graph and answer the question given.
निम्नलिखित दंड आरेख का अध्ययन करें तथा दिए गए प्रश्न का उत्तर दें | The number of companies whose production of motorcycles is equal to or more than the average demand of motorcycles (per year) over five years is:
ऐसी कंपनियों की संख्या कितनी है जिसका मोटरसाइकिल उत्पादन इन पांच वर्षों के दौरान मोटरसाइकिलों की औसत मांग (प्रति वर्ष ) से अधिक या बराबर रहा है ?
View SolutionIn the given bar graph, the Blue bar shows the income and the Red bar shows the expenditure of a company. Study the graph and answer the question that follows
दिए गए दंड आरेख में, नीला दंड एक कंपनी की आय दिखाता है और लाल दंड खर्च (लाख रुपये में) को दर्शाता है। आरेख का अध्ययन करें और उस प्रश्न का उत्तर दें जो नीचे पूछा गया है। The income in 2001 was equal to the expenditure in the year:
2001 में आय किस वर्ष के व्यय के बराबर है :
View SolutionStudy the given chart carefully and answer the question accordingly:
दिए गए चार्ट का ध्यानपूर्वक अध्ययन करें और उसके अनुसार प्रश्न का उत्तर दें: In which of the following years was the percentage increase in production from the previous year, the maximum among the given years?
पिछले वर्ष की तुलना में निम्नलिखित वर्षों में से किस वर्ष में उत्पादन में अधिकतम प्रतिशत वृद्धि हुई?
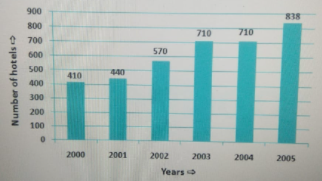
View SolutionStudy the chart and answer the questions:
In which of the given years is the percentage increase in the number of hotels in comparison to the previous year, is the maximum?
चार्ट का अध्ययन करें और प्रश्नों का उत्तर दें:पिछले वर्ष की तुलना में होटलों की संख्या में किस वर्ष में अधिकतम प्रतिशत वृद्धि हुई है?
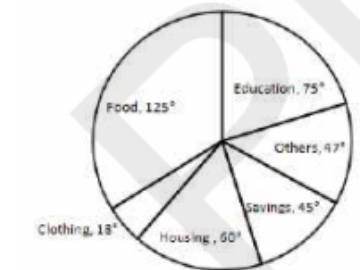
View SolutionThe following pie chart shows the monthly expenditure incurred by a family on various items, and their savings. Study the chart and answer the question that follows
निम्नलिखित पाई चार्ट विभिन्न मदों पर एक परिवार द्वारा किए गए मासिक खर्च और उनकी बचत को दर्शाता है। चार्ट का अध्ययन करें और फिर पूछे गए प्रश्न का उत्तर दें। If the monthly income is ₹64,800, then the yearly savings are:
यदि मासिक आय ₹64,800 है, तो वार्षिक बचत होती है:
View Solution
