निम्नलिखित चित्र को देखें और नीचे दिए गए प्रश्नों के उत्तर दें।
नीचे दिया गया चार्ट होटल में पाँच विभिन्न खाद्य पदार्थों पर एक सर्वेक्षण के परिणामों को दर्शाता है।
विभिन्न खाद्य पदार्थों के लिए प्राथमिकता
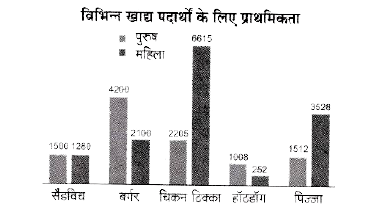
सर्वेक्षण में भाग लेने वाले पुरुषों की औसत संख्या और महिलाओं की औसत संख्या के बीच का अन्तर ज्ञात करें?
(1)640
(2)430
(3)580
(4)670
The correct Answer is:D
Step by step video, text & image solution for निम्नलिखित चित्र को देखें और नीचे दिए गए प्रश्नों के उत्तर दें। नीचे दिया गया चार्ट होटल में पाँच विभिन्न खाद्य पदार्थों पर एक सर्वेक्षण के परिणामों को दर्शाता है। विभिन्न खाद्य पदार्थों के लिए प्राथमिकता सर्वेक्षण में भाग लेने वाले पुरुषों की औसत संख्या और महिलाओं की औसत संख्या के बीच का अन्तर ज्ञात करें? by Maths experts to help you in doubts & scoring excellent marks in Class 14 exams.
Updated on:21/07/2023Similar Questions
The bar graph provided below represents the production of rice and wheat in different states of a country in the certain year. Answer the questions based on the bar graph. नीचे दिये गया बार-ग्राफ एक निश्चित वर्ष में विभिन्न प्रदेशों में चावल और गेहूँ की उपज को दर्शाता है। इस ग्राफ पर आधारित प्रश्नों के उत्तर दें। The difference between the production in rice and wheat is maximum in- चावल की उपज और गेहूँ की उपज में अधि कतम अंतर है-
View Solutionदोहरान |भोजन |विभिन्न प्रकार के खाद्य पदार्थों में क्या होता है ?|भोजन हमारे शरीर में क्या कार्य करता है ?|कार्बोहाइड्रैट |कार्बोहाइड्रैट की उपस्थिति का परीक्षण |सारांश
View SolutionThe bar graph given below shows the number of men and women working in the five different companies.
नीचे दिया गया दंड आरेख पाँच विभिन्न कंपनियों में कार्य करने वाले पुरुषों तथा महिलाओं की संख्या को दर्शाता है |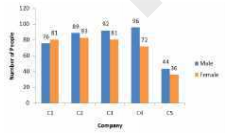 What is the average number of women working per company ?
कार्य करने वाली महिलाओं की प्रति कंपनी औसत संख्या कितनी है ?
View SolutionStudy the given chart and answer the following questions:
दिए गए चार्ट का अध्ययन करें और निम्नलिखित प्रश्नों के उत्तर दें: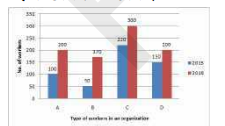 The percentage increase in the number of workers in 2018 is maximum as compared to that is
2015 in case of workers of type:
2018 में श्रमिकों की संख्या में प्रतिशत वृद्धि 2015 की तुलना में अधिकतम है, जो कि किस प्रकार के श्रमिकों के मामले में है?
View SolutionA study was made for the number of persons of different age groups visited in a library in a week which is shown in the histogram. Study the histogram and answer the questions given below.
एक सप्ताह में एक पुस्तकालय में जाने वाले विभिन्न आयु समूहों के व्यक्तियों की संख्या के लिए एक अध्ययन किया गया था जो हिस्टोग्राम में दिखाया गया है। हिस्टोग्राम का अध्ययन करें और नीचे दिए गए प्रश्नों के उत्तर दें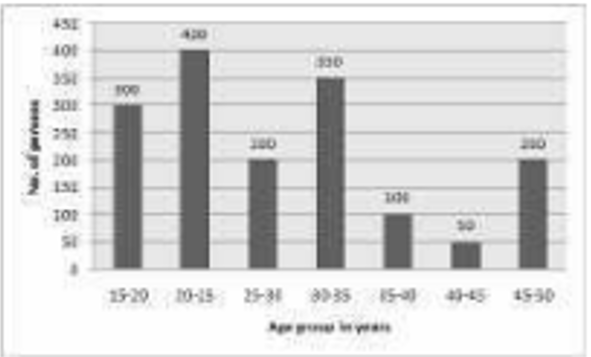 The ratio of the number of persons in the age groups 15-20 years and 20-25 years together, to
the number of persons in the age group 30-35 years and 35-40 years together, is:
View SolutionA study was made for the number of persons of different age groups visited in a library in a week which is shown in the histogram. Study the histogram and answer the questions given below. What percentage of the total number of persons visiting the library in the week was the number of persons of age group 25-30 years?
एक सप्ताह में एक पुस्तकालय में जाने वाले विभिन्न आयु समूहों के व्यक्तियों की संख्या के लिए एक अध्ययन किया गया था जो हिस्टोग्राम में दिखाया गया है। हिस्टोग्राम का अध्ययन करें और नीचे दिए गए प्रश्नों के उत्तर दें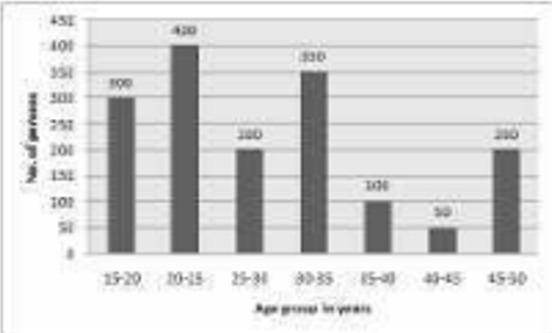
सप्ताह में पुस्तकालय जाने वाले व्यक्तियों की कुल संख्या का कितना प्रतिशत 25-30 वर्ष आयु वर्ग के व्यक्तियों की संख्या थी
View SolutionThe given pie chart shows the percentage distribution of 450 employees in an organization. Study the pie chart and answer the questions that follow
दिए गए पाई चार्ट एक संगठन में 450 कर्मचारियों के प्रतिशत को दर्शाता है। पाई चार्ट का अध्ययन करें और आने वाले प्रश्नों का उत्तर दें।
What is the central angle of the sector representing the number of employees in department A?
विभाग A में कर्मचारियों की संख्या का प्रतिनिधित्व करने वाले क्षेत्र का केंद्रीय कोण क्या है?
View SolutionThe data below shows the number of batsman having different batting averages.
नीचे दिए गए आंकड़ों में विभिन्न बल्लेबाजी औसत वाले बल्लेबाजों की संख्या को दर्शाया गया है |
<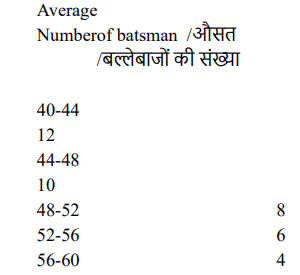
What is the mean batting average per batsman ?
प्रति बल्लेबाज माध्य बललेबाज़ी औसत कितना है ?
View Solution
