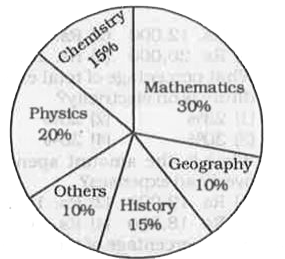
The following pie-chart shows the study-time of different subjects of a student in a day. Study the pie-chart and answer the following questions
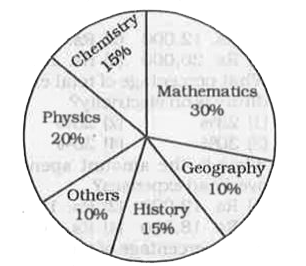
If the student studied chemistry for 3 hours, then he / she studied geography for
1 hour/ 1 घंटा
2 hours/ 2 घंटा
1 hour 30 minutes/ 1 घंटा 30 मिनट
2 hour 30 minutes/ 2 घंटा 30 मिनट
The correct Answer is:D
∵15%=3 hr
∴10%=315×10=2 hrs.
Similar Questions
The following pie-chart shows the study time of different subjects of a students in a day. Study the piechart and answer the following questions.
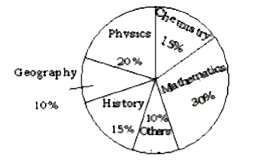
The time spent to study history and chemistry is 4 hours 30 minutes. then the student studied physics for how much time?
View SolutionThe following pie-chart shows the study time of different subjects of a students in a day. Study the piechart and answer the following questions.
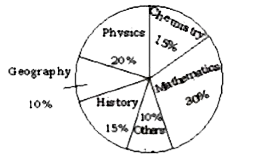
What is the angle subtended by geography and mathematics together at centre?
View Solution
Knowledge Check
The following pie-chart shows the study-time of different subjects of a student in a day. Study the pie-chart and answer the following questions
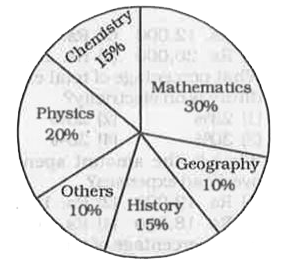
If the student studied 10 hours in a day, then he / she studied mathematics forA3 hoursB103 hoursC13 hoursD310 hoursThe following pie-chart shows the study-time of different subjects of a student in a day. Study the pie-chart and answer the following questions
The time spent to study history and chemistry is 4 hours 30 minutes, Then the student studied physics forA1 hour 30 minutesB2.9 hours (approx.)C2 hoursD3 hoursThe following pie-chart shows the study-time of different subjects of a student in a day. Study the pie-chart and answer the following questions
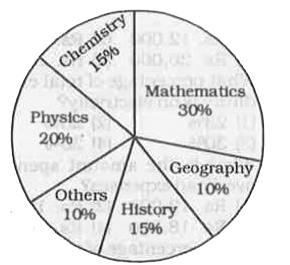
Instead of 10%, if the student spends 15% of study other subjects and the time is taken from the time scheduled to study mathematics and if he / she used to study 20 hours per day, then the difference of time for studying mathematics per day is :A30 minutesB45 minutesC1 hourD1 hour and 30 minutes
Study the pie-chart and answer the questions.
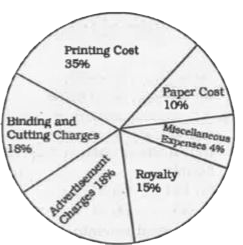
The central angle for the sector on "Paper-Cost" is
View SolutionThe pie-chart shows the breakup in percent age of the various expenses of a Company. Study the diagram and answer the following questions.
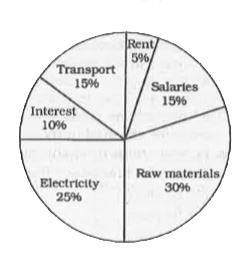
Which is the second biggest expense of the company?
View SolutionThe pie chart shows the breakup of expenditure of a college for the year 2017. Study the diagram and answer the following questions.
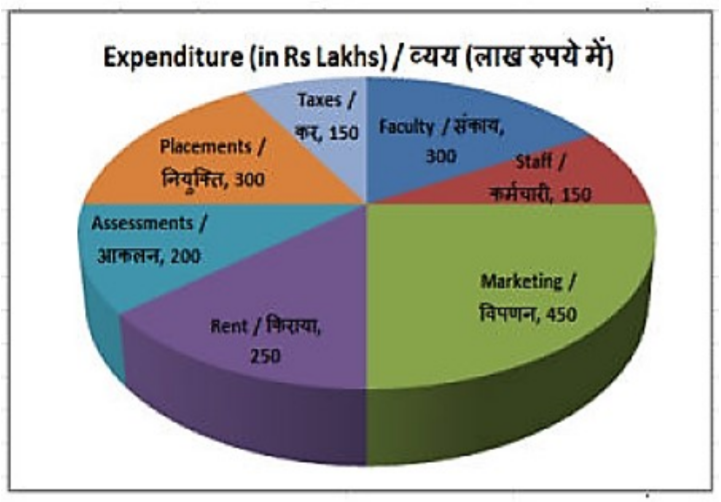
The highest expenditure is for which item?
View SolutionThe pie chart shows the breakup of expendoture of a software company for the year 2017. Study the diagram and answer the following questions.
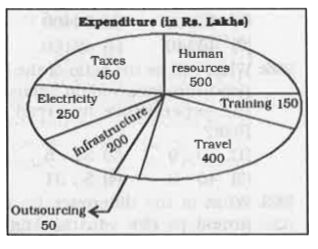
The second highest expenditure is for which item?
View SolutionThe pie chart shows the breakup of expendoture of a software company for the year 2017. Study the diagram and answer the following questions.

The second highest expenditure is for which item?
View Solution
