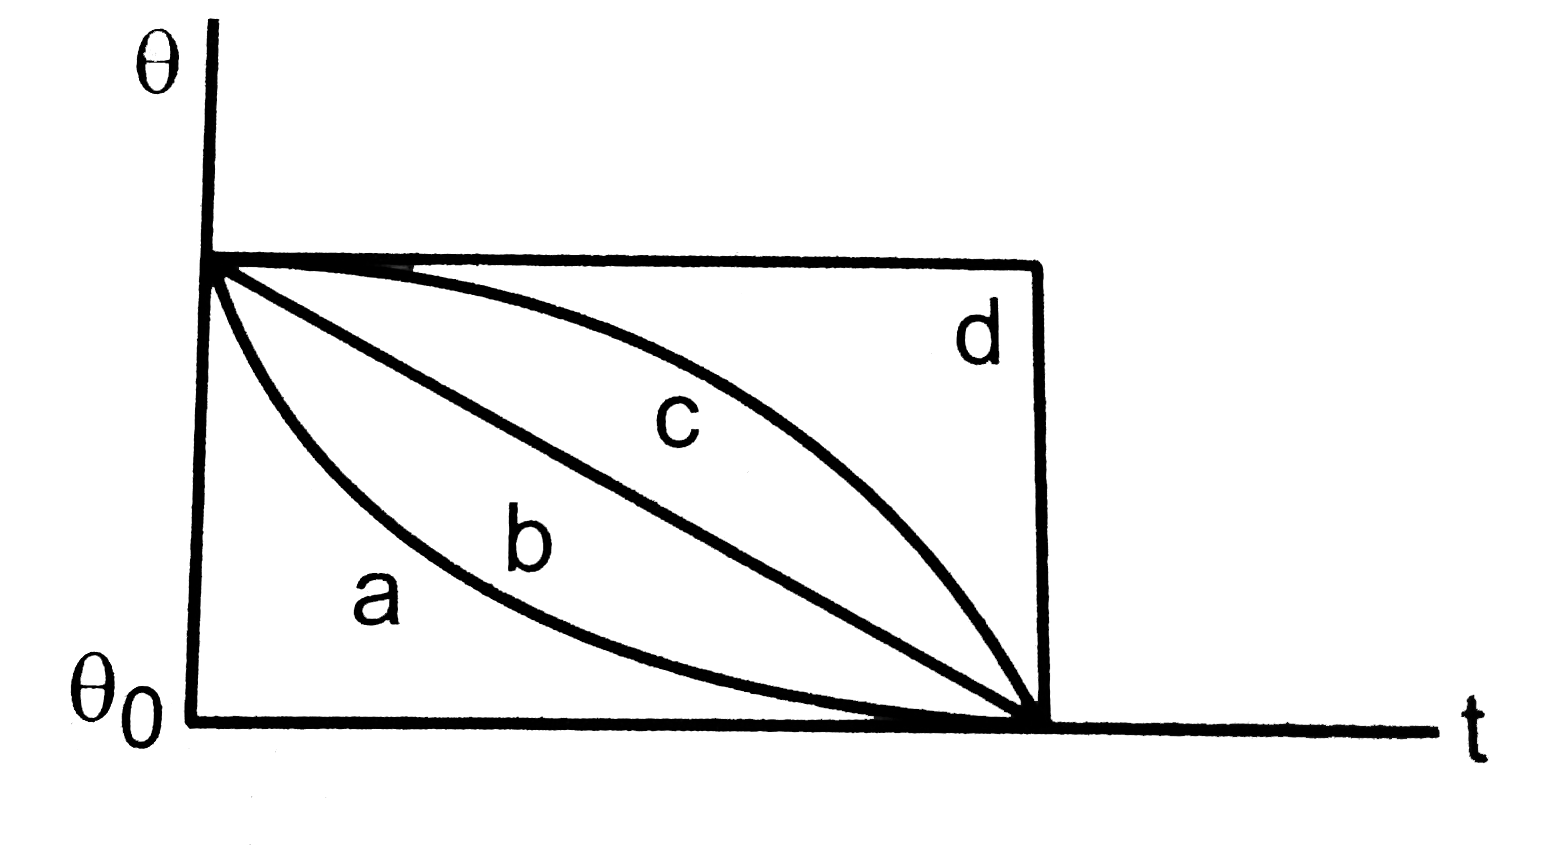
A hot liquid is kept in a big room. Its temperature is plotted as a function of time. Which of the following curves may represent the plot?
 Solution in Tamil
The correct Answer is:A
Topper's Solved these Questions
- HEAT TRANSFERBOOK - HC VERMACHAPTER - HEAT TRANSFEREXERCISE - OBJECTIVE II
6 Videos
- HEAT TRANSFERBOOK - HC VERMACHAPTER - HEAT TRANSFEREXERCISE - EXERCIESE
55 Videos
- HEAT TRANSFERBOOK - HC VERMACHAPTER - HEAT TRANSFEREXERCISE - QUESTIONS FOR SHORT ANSWER
11 Videos
- HEAT AND TEMPERATUREBOOK - HC VERMACHAPTER - HEAT AND TEMPERATUREEXERCISE - Exercise
34 Videos
- INTRODUCTION TO PHYSICSBOOK - HC VERMACHAPTER - INTRODUCTION TO PHYSICSEXERCISE - Exercises
19 Videos
Similar Questions
A centigrade and a Fahrenheit thermometer are dipped in boiling water. The water temperature is lowered until the Fahrenheit thermometer registered at 140°F. What is the fall in temperature as registered by the centigrade thermometer ?
View SolutionA uniform slab of dimension 10cm×10cm×1cm is kept between two heat reservoir at temperatures 10∘C and 90∘C. The larger surface areas touch the reservoirs. The thermal conductivity of the material is 0.80Wm−1C−1 . Find the amount of heat flowing through the slab per minute.
View SolutionThe heat current is written as ΔQΔt . Why don't we write dQdt ?
View SolutionThe steam point and the ice point of a mercury thermometer are marked as 80∘C and 20∘C. What will be the temperature in centigrade mercury scale when this thermometer reads 32∘C?
View SolutionFind the dimensions of
a. linear momentum
b. frequency and
c. pressure
View SolutionA hot liquid is kept in a big room. The logarithm of the numerical value of the temperature difference between the liquied and the room is plot will be very nearly
View SolutionWhich of the following plots may represent the thermal energy produced in a resistor for a given current as a function of time?
View SolutionA hot liquid is kept in a bog room. Accoding to Newton's law of cooling rate of cooling liquid (represented as y) is plotted against its temperature T . Which of the following curves may represent the plot?
View SolutionWhich of the following plots represents schematically the dependence of the time period of a pendulum if measured and plotted as a function of its oscillations? (Note : amplitude need not be small)
View SolutionWhich of the following plots does not represent the behaviour of an ideal binary liquid solution?
View SolutionWhich of the following plots represents the behavior of an ideal binary liquid solution ?
View SolutionA cooling curve is plotted between the temperature of a hot body and time. Which of the following is not true for the cooling curve?
View SolutionWhich of the following represents a plot of compressibility factor (Z) versus P at room temperature for helium?
View SolutionWhich of the following plots represents the behavior of an ideal binary liquid solution ?
View SolutionWhich of the following plots represents the behaviour of an ideal binary liquid solution ?
View SolutionA hot liquid is kept in a big room. The logarithm of the numerical value of the temperature difference between the liquid and the room is plotted against time. the plot will be very nearly
View Solution

