The table below shows income (in rupees) for a particular month, together with their sources in नीचे दी गयी तालिका 5 कर्मचारियों - A, B, C, D और E की एक विशेष माह में विभिन्न स्रोतों से होने वाली आय को दर्शाती है |
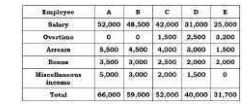 How many employees have their salary more than four times their other income?
कितने कर्मचारियों का वेतन उनकी अन्य आय के चार गुना से अधिक है ?
2
4
3
1
The correct Answer is:A
Step by step video, text & image solution for The table below shows income (in rupees) for a particular month, together with their sources in नीचे दी गयी तालिका 5 कर्मचारियों - A, B, C, D और E की एक विशेष माह में विभिन्न स्रोतों से होने वाली आय को दर्शाती है | How many employees have their salary more than four times their other income? कितने कर्मचारियों का वेतन उनकी अन्य आय के चार गुना से अधिक है ? by Maths experts to help you in doubts & scoring excellent marks in Class 14 exams.
Updated on:21/07/2023Similar Questions
The following table shows the income (in rupees) for a particular month, together with their source, in respect of 5 employees(A,B,C,D and E).
निम्नलिखित तालिका 5 कर्मचारियों ( A.B, C, D तथा E) के संबंध में एक विशेष माह की आय तथा उसके स्रोत को दर्शाती है।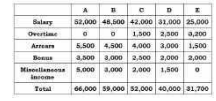 How many employees got more arrears than the average arrears received by all the employees?
कितने. कर्मचारियों को. सभी कर्मचारियों को मिलने वाले औसत बकाया से अधिक बकाया राशि मिली है ?
View SolutionThe following table shows the income (in ₹) for a particular month, together with their source, in respect of 5 employees(A,B,C,D and E).
निम्नलिखित तालिका 5 कर्मचारियों (A, B, C, D तथा E ) के संबंध में एक विशेष माह की आय ( रुपये में ) तथा उसके स्रोत को दर्शाती है |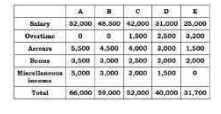 How many employees got more than a total of ₹ 10,000 as income other than salary?
कितने कर्मचारियों को वेतन के अतिरिक्त कुल 10,000 रुपये से अधिक की आय हुई है ?
View Solution
Knowledge Check
The table below shows income (in rupees) for a particular month, together with their sources in नीचे दी गयी तालिका 5 कर्मचारियों - A, B, C, D और E की एक विशेष माह में विभिन्न स्रोतों से होने वाली आय को दर्शाती है |
 How many employees have their salary more than four times their other income?
कितने कर्मचारियों का वेतन उनकी अन्य आय के चार गुना से अधिक है ?A2B4C3D1The following table shows the income (in rupees) for a particular month, together with their source, in respect of 5 employees(A,B,C,D and E).
निम्नलिखित तालिका 5 कर्मचारियों ( A.B, C, D तथा E) के संबंध में एक विशेष माह की आय तथा उसके स्रोत को दर्शाती है। How many employees got more arrears than the average arrears received by all the employees?
कितने. कर्मचारियों को. सभी कर्मचारियों को मिलने वाले औसत बकाया से अधिक बकाया राशि मिली है ?A2B1C4D3The following table shows the income (in ₹) for a particular month, together with their source, in respect of 5 employees(A,B,C,D and E).
निम्नलिखित तालिका 5 कर्मचारियों (A, B, C, D तथा E ) के संबंध में एक विशेष माह की आय ( रुपये में ) तथा उसके स्रोत को दर्शाती है | How many employees got more than a total of ₹ 10,000 as income other than salary?
कितने कर्मचारियों को वेतन के अतिरिक्त कुल 10,000 रुपये से अधिक की आय हुई है ?A3B2C4D1
The following table shows the income (in rupees) for a particular month, together with their source, in respect of 5 employees(A,B,C,D and E)
निम्नलिखित तालिका 5 कर्मचारियों (A, B, C, D तथा E) के संदर्भ में एक विशेष महीने की आय तथा उसके स्रोत को दर्शाती है | For employee D, the income from overtime is what percentage of his total income?
कर्मचारी D के लिए, ओवरटाइम से होने वाली आय उसकी कुल आय का कितना प्रतिशत है ?
View SolutionThe table shows Income and expenditure of a person for 3 years (in thousands)
यह तालिका 3 वर्षों के दौरान किसी व्यक्ति के आय एवं व्यय (हज़ार में ) को दर्शाती है |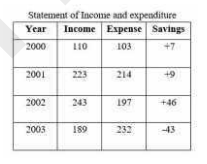 In the given table, what is the percentage of expenditure on income in the year 2002? (round
off)
दी गयी तालिका के अनुसार, वर्ष 2002 में आय पर व्यय का प्रतिशत कया है?
View SolutionThe table given below presents the figures of the production (in thousands) of different types of vehicles by a company during the year 2013-18.
नीचे दी गयी तालिका वर्ष 2013-18 के दौरान एक कंपनी के द्वारा विभिन्न प्रकार के वाहनों के उत्पादन ( हज़ार में)के आंकड़ों को प्रस्तुत करती है |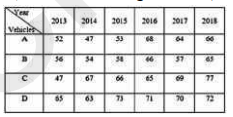 In how many years is the production of type C vehicles, below the average production of type D vehicles over six years?
कितने वर्ष C प्रकार के वाहनों का उत्पादन इन छः वर्षों में D प्रकार के वाहनों के औसत उत्पादन से कम रहा है ?
View SolutionThe Bar graph shown below presents the number of employees in an office during eight consecutive years.
नीचे दिया गया दंड आरेख किसी कार्यालय में आठ लगातार वर्षों के दौरान कर्मचारियों की संख्या को दर्शाता है |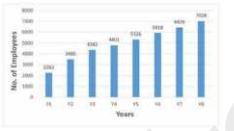
The number of employees in year Y2 is how much percent less than the average number of employees per year?
वर्ष Y2 में कर्मचारियों की संख्या प्रति वर्ष कर्मचारियों की औसत संख्या से कितना प्रतिशत कम है ?
View SolutionThe table shows Income and expenditure of a person for 3 years (in thousands)
यह तालिका 3 वर्षों के दौरान किसी व्यक्ति के आय एवं व्यय (हज़ार में ) को दर्शाती है |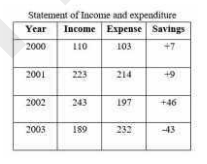 In the given table, if a person reduced his expenditure by 10% by how much would his total
savings increased?
दी गयी तालिका के अनुसार यदि व्यक्ति अपने व्यय में 10% की कमी कर ले, तो उसकी बचत में कुल कितनी वृद्धि होगी ?
View Solution
