Table shows the production of rice of three states over six years
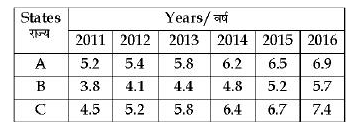
What is the ratio of the production of rice in all three states in the year 2014 to that in 2016?
The correct Answer is:A
Step by step video & text solution for Table shows the production of rice of three states over six years What is the ratio of the production of rice in all three states in the year 2014 to that in 2016? by Maths experts to help you in doubts & scoring excellent marks in Class 14 exams.
Updated on:21/07/2023Similar Questions
Knowledge Check
What is the production of rice in 1949-50?
A116263.63B1,23,460C1,40,679Dnone of theseRs. 5000 becomes Rs. 6200 in 4 years at a certain rate of interest. If the rate becomes 1.5 times of itself, the amount of the same principal in 5 years will be
A(a) 5536B(b) 5996C(c) 6886D(d) 7250What is the average production of rice in state A over the years.
A6B6.1C5.8D5.9
Table shows the production of rice (in million tonnes) of three states over six years.
यह तालिका तीन राज्यों में छः वर्षों में दौरान चावल के उत्पादन ( मिलियन टन में ) को दर्शाती है | What is the ratio of the production of rice in all three states in the year 2014 to that in 2016?
सभी तीन राज्यों में वर्ष 2014 तथा 2016 में उत्पादित चावल की मात्रा में अनुपात ज्ञात करें |
View SolutionThe table shows the production of different types of cars (in thousands).

What is the ratio of the total production of types E cars in 2014 and type C cars in 2016 taken together to the total production of type B cars in 2014 and type D cars in 2013 taken together ?
View SolutionThe table shows the production (in thousands) of different types of cars.
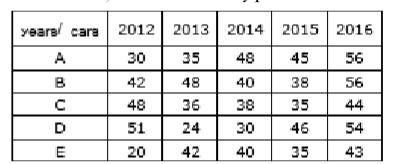
What is the ratio of total production of C type cars in year 2013 & A in year 2014 and the total production of B in year 2016 & E type cars in 2015?
View SolutionThe Table shows the number of cars sold by three showrooms over a period of six years.
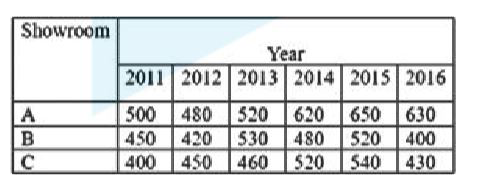
What is the ratio of the total cars sold by showroom B during the years 2014 and 2016 and the total cars sold by showroom C during 2015 and 2016?
View SolutionThe following graph shows the production of cotton cloth (in lakh metres) by three companies A, B and C over the years.
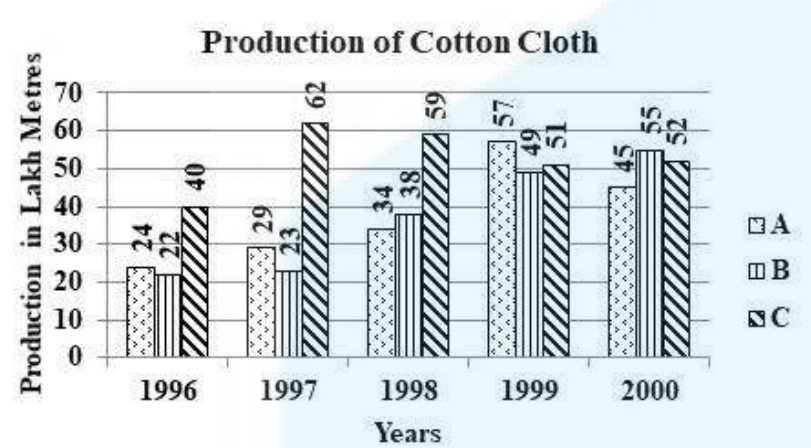
What is the ratio of the production of Company C in the years 1996 and 1997 to the production of Company B in the years 1999 and 2000?
View Solution

