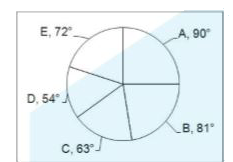
The pie chart given below shows the number of students in 5 sections .The number of students is 7200.
The number of students in section A is what percent of that of section B?
a)90
b)110
c)109
d)111.11
The correct Answer is:D
Step by step video, text & image solution for The pie chart given below shows the number of students in 5 sections .The number of students is 7200. The number of students in section A is what percent of that of section B? by Maths experts to help you in doubts & scoring excellent marks in Class 14 exams.
Updated on:21/07/2023Similar Questions
The pie chart given below shows the number of students in 6 different sections. The total number of students is 1800.
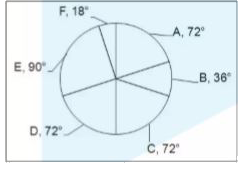
What is the ratio of number of students in section D to the number of students in section F and B?
View SolutionThe pie chart given below shows the number of students in 6 different sections. The total number of students is 1800.
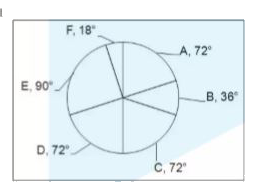
What is the total number of students in section E, C and F?
View Solution
Knowledge Check
The pie chart given below shows the number of students in 5 sections .The number of students is 7200.
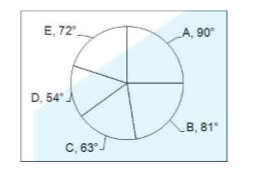
What is the total number of students in section E and section B?Aa)3060Bb)2900Cc)5300Dd)6000The pie chart given below shows the number of students in 5 sections .The number of students is 7200.
What is the difference between the number of students in section C and section D?
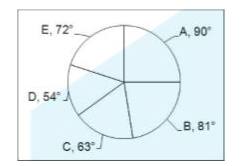 Aa)86Bb)180Cc)196Dd)42
The pie chart given below shows the number of students in 5 sections .The number of students is 7200.
What is the average number of students of the 2 smallest sections?
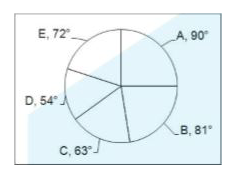 Aa)18060Bb)1170Cc)1600Dd)1730
The pie chart given below sows the number of students in 6 different sections. The total number of students is 1800.
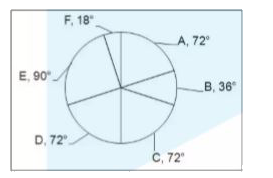
What is the average number of students in section A, B and F?
View SolutionThe pie chart given below shows the number of students in 6 different sections. The total number of students is 1800.
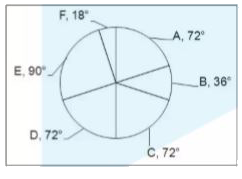
What is the difference between the number of students in section F to the number of students in section C?
View SolutionThe line chart given below shows the number of students in 2 sections X and Y from year 2009 to 2016.
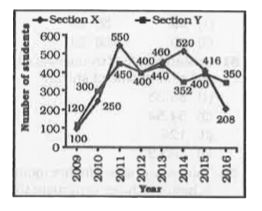
The number of students in section Y in year 2015 is what percentage of the number of students in section X in year 2012?
View SolutionThe line chart given below shows the number of students in 2 sections X and Y from year 2009 to 2016.
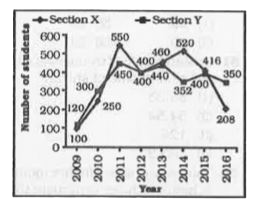
For how many years was the number of students in section Y was more than that of section X?
View SolutionThe table given below shows the number of students adimitted in 2 sections X and Y from year 2011 to 2015.
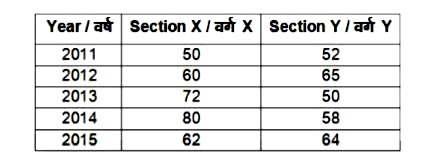
In year 2012, the number of students admitted in section Y is what percent of that of the number of students admitted in section X?
View Solution
