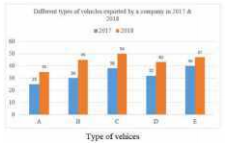
The given Bar Graph presents the number of different types of vehicles exported by a company in 2017 and 2018.The average export of vehicles in 2018 is what percent more than the export of vehicle A in 2017?
76
3712
4623
68
The correct Answer is:A
Step by step video, text & image solution for The given Bar Graph presents the number of different types of vehicles exported by a company in 2017 and 2018.The average export of vehicles in 2018 is what percent more than the export of vehicle A in 2017? by Maths experts to help you in doubts & scoring excellent marks in Class 14 exams.
Updated on:21/07/2023Similar Questions
The given Bar Graph presents the number of different types of vehicles exported by a company in 2017 and 2018.The increase in the exports in 2018 as compared to that in 2017 is closest to 32% in case of vehicles of type:
दिया गया दंड आरेख एक कंपनी के द्वारा 2017 और 2018 में निर्यात किये गए अलग-अलग प्रकार के वाहनों की संख्या को दर्शाता है |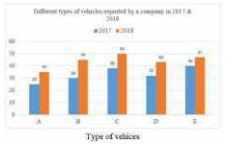
किस प्रकार के वाहनों के मामले में 2017 की तुलना में 2018 में निर्यात में हुई वृद्धि 32% के लगभग है :
View SolutionThe given Bar Graph presents the number of different types of vehicles exported by a company in 2017 and 2018.What is the ratio of the total number of vehicles exported in 2017 of types B, C and D to that of vehicles exported in 2018 of the types A, D and E?
दिया गया दंड आरेख एक कंपनी के द्वारा 2017 और 2018 में निर्यात किये गए अलग-अलग प्रकार के वाहनों की संख्या को दर्शाता है |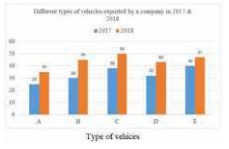
2017 में निर्यात किये गए B, C और D प्रकार के वाहनों की कुल संख्या का 2018 में निर्यात किये गए A, D और E प्रकार के वाहनों की संख्या के साथ अनुपात ज्ञात करें |
View Solution
Knowledge Check
The given bar graph presents Different type of Vehicles exported by a company in 2016 and 2017?
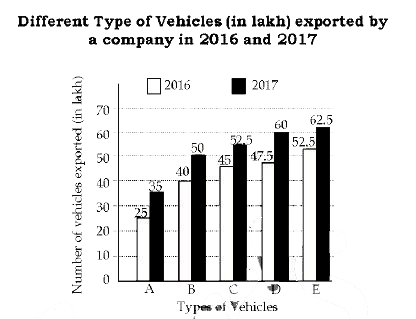
The export of which type of vehicle in 2017 is approximately 18.3% more than that export of same type of vehicle in 2016.ACBDCEDBIn given bar graph presents the number of different types of vehicles exported by a company during 2014?
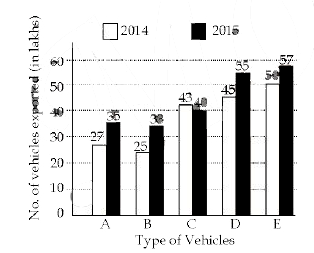
The total number of type B,D and E vehicles exported in 2014 is what percentage of the total number of type A,C,D and E vehicles exported in 2015A0.624B0.616C0.638D0.642The given Bar Graph presents Different Type of Vehicles (in lakhs) exported by a company in 2016 and 2017.
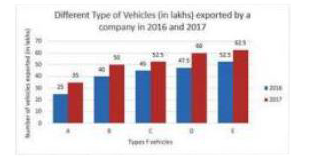
The total number of vehicles of type C and E exported by the company in 2017 is what percentage (correct to one decimal place) more than the total number of vehicles of type A, B and C exported in 2016?A5.4B4.5C4.1D5.2

The average number of type A,B and D vehicles exported in 2015 was x% less than the number of type E vehicles exported in 2014 what is the value of x?
View SolutionThe given Bar Graph presents different types of vehicles (in lakhs) exported by a company in 2016 and 2017. The average number of all types of vehicles exported by the company in 2016 is what percent less than the number of type B vehicles exported in 2017?
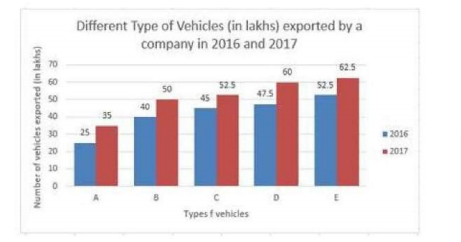
View SolutionThe given Bar Graph presents different types of vehicles (in lakhs) exported by a company in 2016 and 2017. The average number of all types of vehicles exported by the company in 2016 is what percent less than the number of type B vehicles exported in 2017? दिया गया दंड आरेखा (बार ग्राफ) 2016 और 2017 में किसी कंपनी द्वारा निर्यात किए गए विभिन्न प्रकार के वाहनों (लाखों में) को दर्शाता है| 2016 में कंपनी दवारा निर्यात किए गए सभी प्रकार के वाहनों की औसत संख्या, 2017 में निर्यात किए गए टाइप B वाहनों की संख्या से कितने प्रतिशत कम है?

View SolutionThe given bar graph presents the number of different types of vehicles (in lakhs) exported by a company during 2014 and 2015.
दिया गया दंड आरेख एक कंपनी के द्वारा 2014 और 2015 में निर्यात किये गए अलग-अलग प्रकार के वाहनों की संख्या ( लाख में ) को दर्शाता है |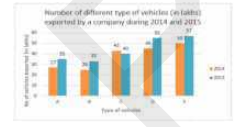 What is the ratio of the total number of type A and C vehicles exported in 2014 to the total number of type B and E vehicles exported in 2015?
2014 में निर्यात किये गए A और C प्रकार के वाहनों की कुल संख्या का 2015 में निर्यात किये गए B एवं E प्रकार के वाहनों की कुल संख्या के साथ अनुपात ज्ञात करें |
View SolutionThe given Bar Graph presents the Export of Tea and Coffee (in million kg) for the years 2012 to 2016.
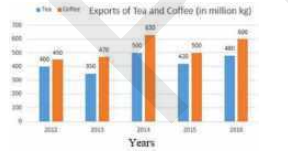 Total export of coffee is approximately what percent more than the total export of tea during
the five years?
View Solution
