The pie chart given below presents the percentage of the number of motor cycles of different colours out of the total number of motor cycles, parked in an area. The central angles shown in the Pie chart are not as per any chosen scale.
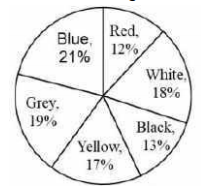 If the total number of motor cycles parked is 2300, the number having white colour is how much less than those having the blue colour?
63
72
69
66
The correct Answer is:C
Step by step video, text & image solution for The pie chart given below presents the percentage of the number of motor cycles of different colours out of the total number of motor cycles, parked in an area. The central angles shown in the Pie chart are not as per any chosen scale. If the total number of motor cycles parked is 2300, the number having white colour is how much less than those having the blue colour? by Maths experts to help you in doubts & scoring excellent marks in Class 14 exams.
Updated on:21/07/2023Similar Questions
The pie chart given below presents the percentage of the number of motor cycles of different colours out of the total number of motor cycles, parked in an area. The central angles shown in the Pie chart are not as per any chosen scale.
नीचे दिया गया वृत्त-आरेख किसी क्षेत्र में खड़ी की गयीं कुल मोटरसाइकिलों में से अलग-अलग रंग की मोटरसाइकिलों की संख्या का प्रतिशत दर्शाता है | इस वृत्त-आरेख में दिए गए केंद्रीय कोण किसी भी चयनित पैमाने के अनुसार नहीं हैं |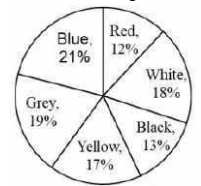 If the total number of motor cycles parked is 2300, then what is the number of red colour motor
cycles out of them?
यदि खड़ी की गयी मोटरसाइिकलों की कुल संख्या 2300 है, तो इनमें से लाल रंग की मोटरसाइिकल कितनी है ?
View SolutionThe pie chart given below presents the percentage of the number of motor cycles of different colours out of the total number of motor cycles, parked in an area. The central angles shown in the Pie chart are not as per any chosen scale.
नीचे दिया गया वृत्त-आरेख किसी क्षेत्र में खड़ी की गयीं कुल मोटरसाइकिलों में से अलग-अलग रंग की मोटरसाइकिलों की संख्या का प्रतिशत दर्शाता है | इस वृत्त-आरेख में दिए गए केंद्रीय कोण किसी भी चयनित पैमाने के अनुसार नहीं हैं | If the total number of motor cycles parked is 2300, the number having white colour is how much less than those having the blue colour?
यदि खड़ी की गयी मोटरसाइकिलों की कुल संख्या 2300 है, तो सफ़ेद रंग की मोटरसाइकिलों की संख्या नीले रंग की मोटरसाइकिलों की संख्या से कितनी कम है ?
View Solution
Knowledge Check
The pie Chart given below presents the number of laptops as a percentage of the total number of laptops in an office delivered by six different companies.
The central angles shown in the Pie Chart are not as any chosen scale.
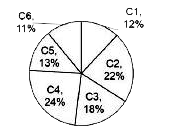
If the total number of laptops in the office is 3800, then what is the difference in number of laptops of Companies C2 and C5 ?A342B282C242D362The Pie Chart given below presents the number of laptops as a percentage of the total number of laptops in an office delivered by six different companies.
The central angles shown in the Pie Chart are not as any chosen scale.
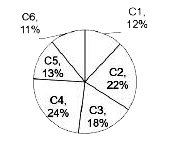
What is the ratio of the number of laptops of Company C1 to that of Company C3 ?A2:3B12:11C2:1D6:11The pie Chart given below presents the number of laptops as a percentage of the total number of laptops in an office delivered by six different companies.
The central angles shown in the Pie Chart are not as any chosen scale.
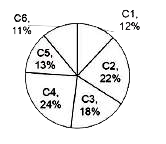
What is the central angle in degrees (correct up to one decimal place) corresponding to the laptops delivered by Company C6 ?Aa. 51.7∘Bb. 39.6∘Cc. 45.1∘Dd. 52.8∘
The pie chart given below presents the percentage of the number of motor cycles of different colours out of the total number of motor cycles, parked in an area. The central angles shown in the Pie chart are not as per any chosen scale.
नीचे दिया गया वृत्त-आरेख किसी क्षेत्र में खड़ी की गयीं कुल मोटरसाइकिलों में से अलग-अलग रंग की मोटरसाइकिलों की संख्या का प्रतिशत दर्शाता है | इस वृत्त-आरेख में दिए गए केंद्रीय कोण किसी भी चयनित पैमाने के अनुसार नहीं हैं |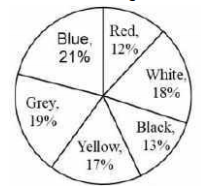 What is the central angle (nearest to one degree) corresponding to the motor cycles of black colour?
काले रंग की मोटरसाइकिल का संगत केंद्रीय कोण कितने डिग्री (एक डिग्री के निकटतम ) का है ?
View SolutionThe pie chart given below shows the number of students in 6 different sections. The total number of students is 1800.
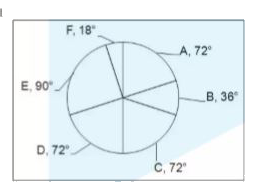
What is the total number of students in section E, C and F?
View SolutionThe pie chart given below sows the number of students in 6 different sections. The total number of students is 1800.
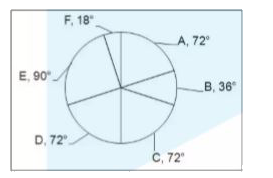
What is the average number of students in section A, B and F?
View SolutionDirection :- Given below is the pie chart which shows the percentage distribution of a book 'XYZ'.
Published in 5 different stores.
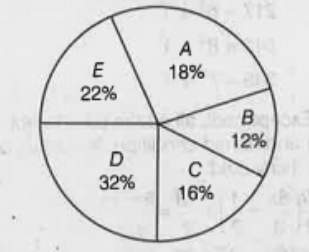
Total number of books = 550
Find the central angle for the book D.
View SolutionThe Bar graph given below presents the number of cars parked on ten different days in a parking area
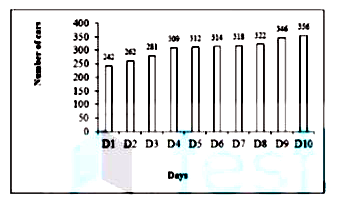
What is the total number of cars parked on all the ten days in the parking area ?
View Solution
