The following chart shows the results of three athletic academies in the district level selections for three years. 
How many selections were done in the year 2014 for academy 'C'?
19
9
7
3
The correct Answer is:B
Step by step video, text & image solution for The following chart shows the results of three athletic academies in the district level selections for three years. How many selections were done in the year 2014 for academy 'C'? by Maths experts to help you in doubts & scoring excellent marks in Class 14 exams.
Updated on:21/07/2023Similar Questions
The given bar chart, shows the sales for sets of television of three companies in three years.
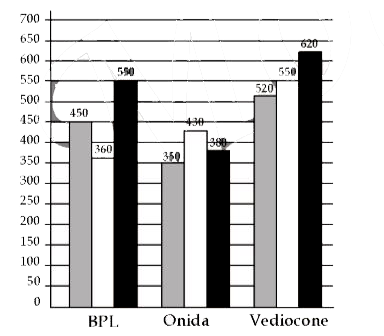
In the given bar chart what is the ratio of television sales between A in year 1992 ad C in year 1991?
View SolutionThe given bar chart shows the sales for sets of television of three companies in three years
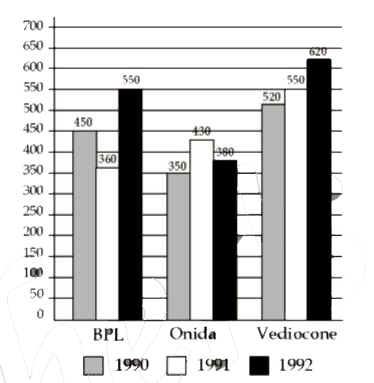
In the given bar chart, what is a difference between the average sales of television BPL and Onida for 3 years
View Solution
Knowledge Check
The following Bar graph shows information of the results in the national level entrance exam by the institute ''ABC'' for the last 5 years.
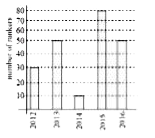
In the year 2015, how many ranks were scored from institute ''ABC'' ?A90B80C60D70The following graph shows the production of cotton cloth (in lakh metres) by three companies A, B and C over the years.
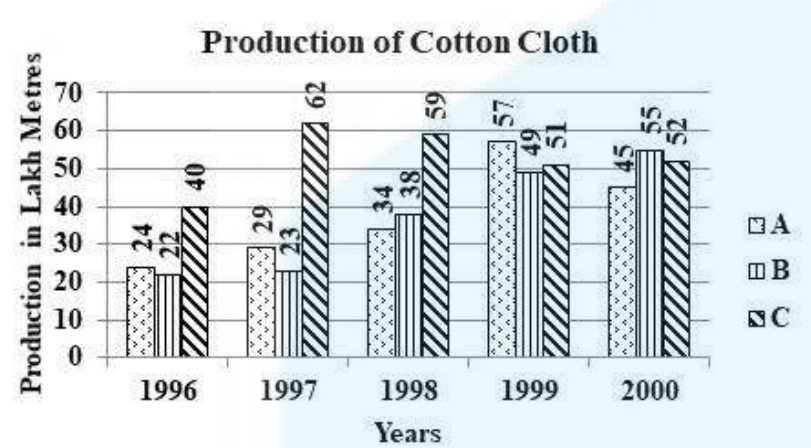
What is the ratio of the production of Company C in the years 1996 and 1997 to the production of Company B in the years 1999 and 2000?A3:11B51:52C11:3D52:51Table shows the production of rice of three states over six years
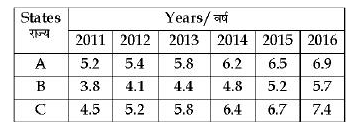
What is the ratio of the production of rice in all three states in the year 2014 to that in 2016?A85:102B89:102C85:103D87:100
The table below shows the admission and transfer in standars 1-3 of a school

IN the given table in standard 1 how many students were there at the end of year 2016
View SolutionThe table below shows the admission and transfer in standards 1-3 of a school.

In the given table, in Standard 1, how many students were there at the end of year 2016?
View SolutionIf a sum of money at compound interest amounts to thrice itself in 3 years then in how many years will it be 9 times itself?
View SolutionThe sum-divided bar-diagram given below depicts the result of B.Sc. Students of a college for three years.
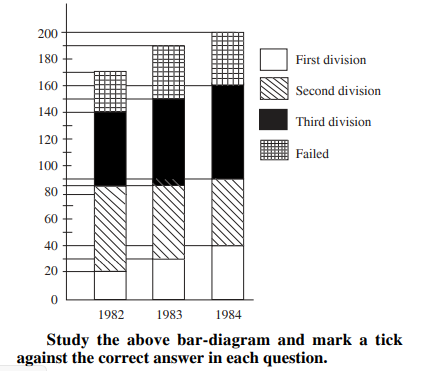
How many percent passed in Ist division in 1982 ?
View SolutionThe line chart given below shows the sales (in crores) of a complany for the years 2009 to 2016
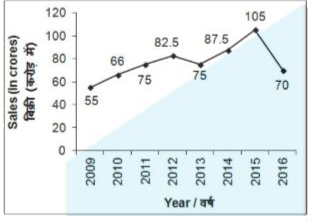
In how many years was the sale of the company more than the sale in 2011?
View Solution
