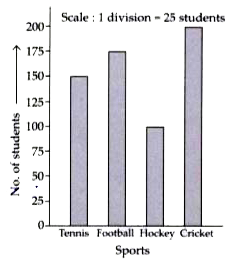
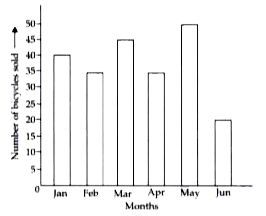
Study the given bar graph and answer the following questions accordingly.
The bar graph shows the three different types of pizzas sold by Pizza Hut in four different weeks.
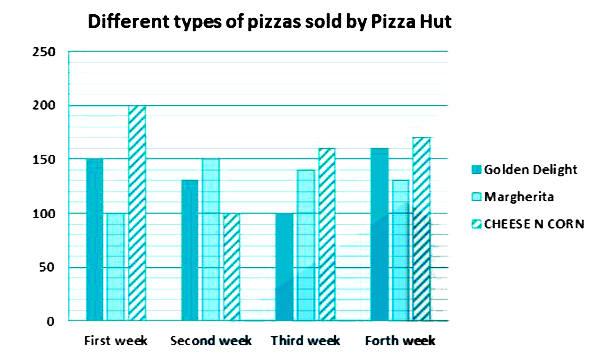
The number of Golden Delight pizzas sold in the first and second week is what percent more/less than the number of CHEES N CORN pizzas sold in the first and second week?
7.14% more
6.66% less
6.66% more
7.14% less
The correct Answer is:B
Step by step video, text & image solution for Study the given bar graph and answer the following questions accordingly. The bar graph shows the three different types of pizzas sold by Pizza Hut in four different weeks. The number of Golden Delight pizzas sold in the first and second week is what percent more/less than the number of CHEES N CORN pizzas sold in the first and second week? by Maths experts to help you in doubts & scoring excellent marks in Class 14 exams.
Updated on:21/07/2023Similar Questions
Knowledge Check
What is the ratio between the number of Margherita pizzas sold in third and fourth weeks, and the number of CHEESE N CORN pizzas sold in first and third weeks?
A3:4B4:3C1:4D3:5
Study the following bar graph and answer the questions given below
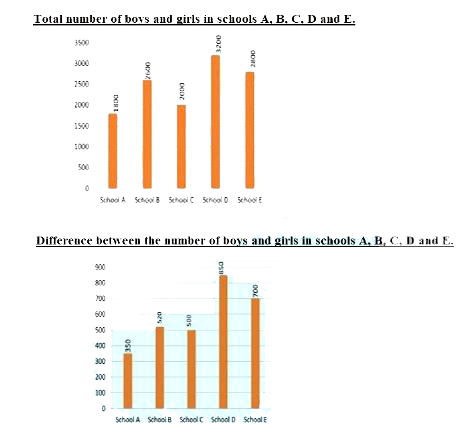
What is the difference the number of girls in school A and the number of girls in school C?
View SolutionStudy the following bar graph and answer the questions given below.
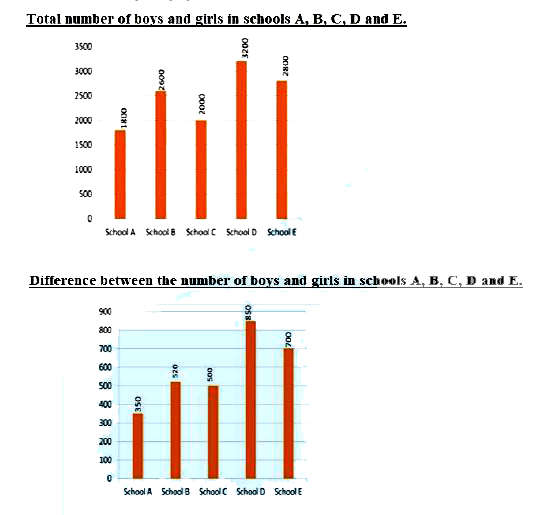
What is the ratio of numbers of boys to the number of girls in school E?
View SolutionThe given pictograph shows the number of pizzas delivered by pizza hut during a week.
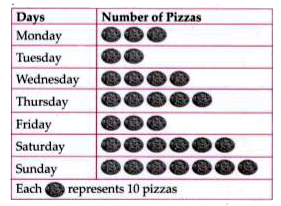
On which day, the number of pizzas delivered is minimum?
View SolutionThe given pictograph shows the number of pizzas delivered by pizza hut during a week.
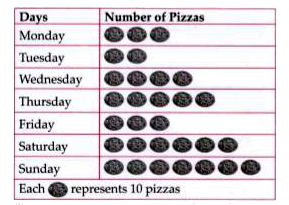
Find the number of pizzas delivered on Sunday.
View SolutionDirection: Read the following Bar graph carefully and answer the following questions: The following bar graph shows the number of visitors to the Taj Mahal in the first week of January.
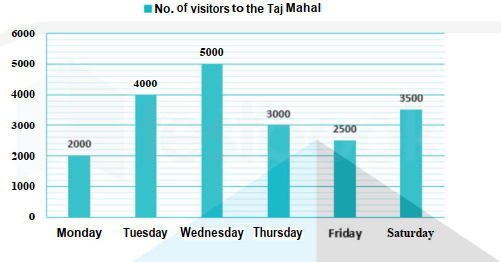
The number of visitors on Saturaday is what percentage more than that of Friday
View SolutionDirections: Study the Pie chart and answer the following question. The pie chart is showing the percentage of different types of shirts sold by five different stores namely A, B, C, D and E.
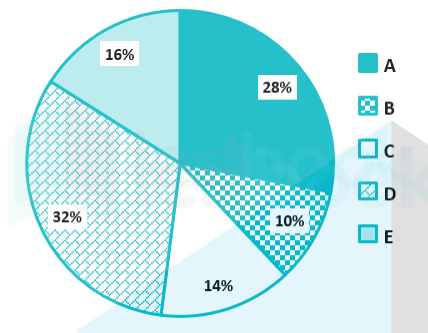
If the difference in shirt sold by store C and store D is 1800. Find the number of shirts sold by store D.
View SolutionDirection: Study the data carefully and answer the following questions. Following is the data given of selling 2 types of pizza from 4 shops A, B, C and D.
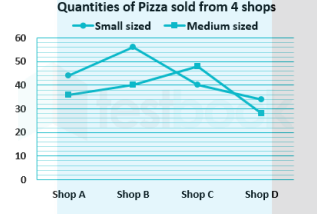
Find the ratio between total number of pizzas sold from shop C to that of shop B.
View Solution

