What is the average of failed students in five academic years?
75
50
100
90
The correct Answer is:D
Step by step video & text solution for What is the average of failed students in five academic years? by Maths experts to help you in doubts & scoring excellent marks in Class 14 exams.
Updated on:21/07/2023Similar Questions
The line graph shows the number of students of a certain university who failed in the given year in their final exams. Study the diagram and answer the following questions
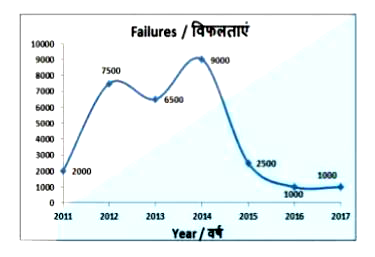
What is the average number of failures in the last three years?
View SolutionThe given bar graph presents the results in terms of the number of students in a school of the five academic years, 2013-2014 to 2017-2018.
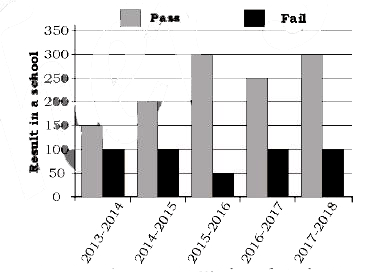
What is the average number of students who passed in the five academic years?
View Solution
Knowledge Check
What is the approximate percentage of students passed during five academic years
A0.72B0.78C0.79D0.73What is the average of export during the five financial years?
A1279.6B1279.5C1552.4D1025.9The line chart given below shows the number of students in 2 sections X and Y from year 2009 to 2016.
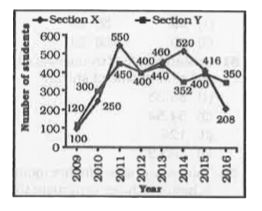
What is the average number of students in section X from year 2009 to year 2014?A400B380C464D396
The given Bar Graph presents the results in terms of the number of students in a school for the five academic years, 2013-2014 to 2017-2018.
दिया गया दंड आरेख पांच शैक्षणिक वर्षों : 2013-2014 से 2017-2018 तक एक विद्यालय में छात्रों की संख्या के संदर्भ में परिणामों को प्रस्तुत करता है |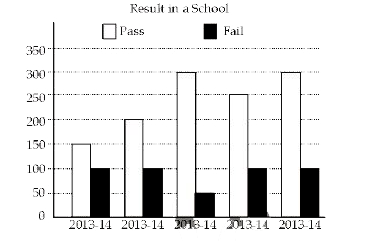 What is the average number of students who passed in the five academic years?
पांच शैक्षणिक वर्षों में पास करने वाले छात्रों की औसत संख्या कया है ?
View SolutionThe average ages of boys and girls in a class is 14.5 years and 15 years respectively. If the ratio of the number of boys and girls is 2 : 3, then what is the average age(in years) of all students in the class?
View SolutionThe given Bar Graph presents the results in terms of the number of students in a school for the five academic years, 2013-2014 to 2017-2018.
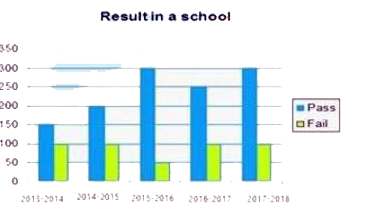
What is the average number of students who passed in the five academic years?
View SolutionThe given Bar Graph presents the results in terms of the number of students in a school for the five academic years, 2013-2014 to 2017-2018.
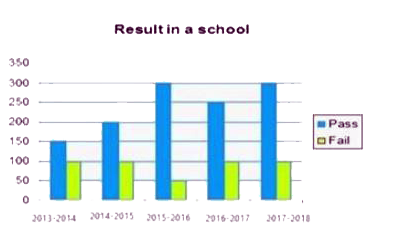
In which year the percentage increase in total number of students is the lowest in comparison to its previous academic year
View SolutionQuestion Stimulus
The average age of 30 students in a class is 16 years. The average age of 18 students in this group is 7 years. The average age of remaining 12 students is
View Solution
