Direction: Study the following data carefully and answer the following questions. The bar graph represents the percentage of people present in the bus just after every station.
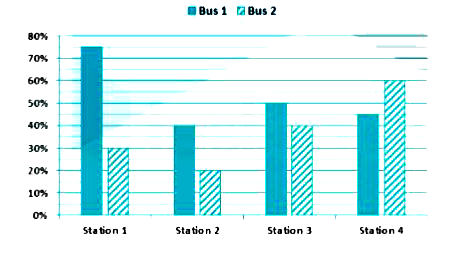
After station 1, if 20% of previously present people getting into the Bus 1 at every Station (if there is space) then what percent seats remain empty after Station 2?
10%
9%
5%
7%
The correct Answer is:A
Step by step video, text & image solution for Direction: Study the following data carefully and answer the following questions. The bar graph represents the percentage of people present in the bus just after every station. After station 1, if 20% of previously present people getting into the Bus 1 at every Station (if there is space) then what percent seats remain empty after Station 2? by Maths experts to help you in doubts & scoring excellent marks in Class 14 exams.
Updated on:21/07/2023Similar Questions
Direction: Study the data carefully and answer the following questions. Following is the production data by 4 persons during 2 months.
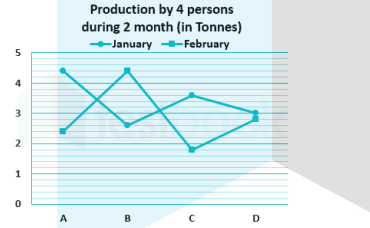
Production by A in January in what % more than production by B in January (Approx)?
View SolutionDirection: Study the data carefully and answer the following questions. Following is the data given of selling 2 types of pizza from 4 shops A, B, C and D.
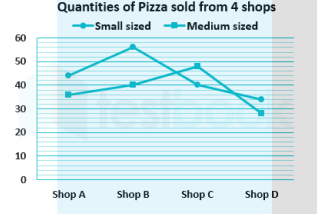
Total number of pizzas sold from shop D is what % of total number of pizzas sold from shop A?
View Solution
Knowledge Check
Study the following graph carefully and answer the question given below.
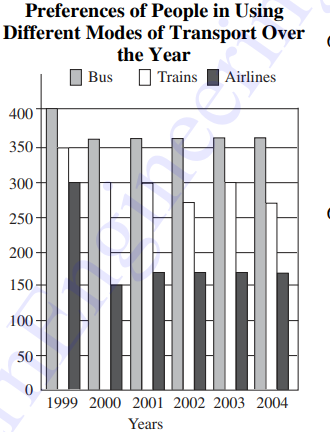
What is the respective the number of people preferring to travel by bus to the number of people preferring to travel by train in the year 2002?A15:11B9:7C7:9D11:15Study the following graph carefully and answer the question given below.
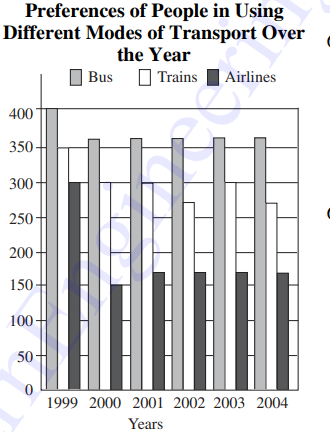 In 2001, the people preferring to travel by bus represented approximately what percent of the people preferring to travel by buses, trains and airlines together in that year? A65%B25%C55%D45%
Study the table carefully to answer the following questions ----
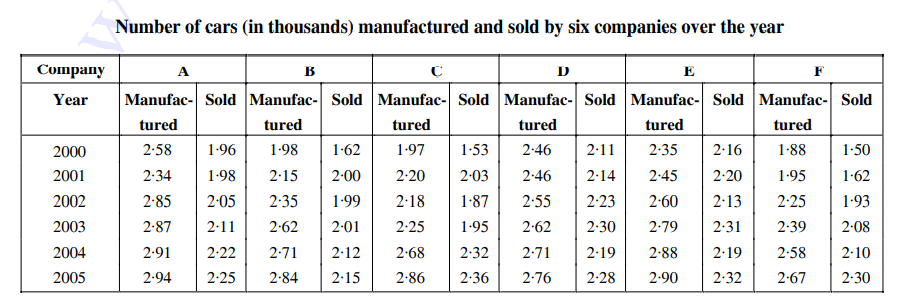
What is the percentage of number of cars sold by company D in the year 2002 to those manufactured by it in that year ? (rounded off to two digits after decimal)A87.45B77.28C92.54D79.65
Study the following information carefully and answer the given questions. Data below represent number of people required for various project to be completed in various days :

If 0.5 Y people work on project B for 10 days and then 0.5Y people join the project after 10 days. How many days will it take to complete the Project B?
View SolutionStudy the following information carefully and answer the given questions. Data below represent number of people required for various project to be completed in various days :

If in Team P, total number of workers =0.5Z×2M, then what is the number of days required by Team P to complete Project C?
View SolutionDirection: Study the data carefully and answer the following questions. Following is the data given of selling 2 types of pizza from 4 shops A, B, C and D.
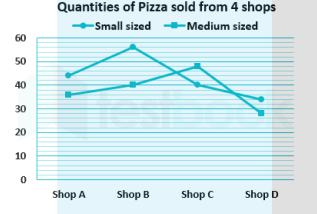
If the number of large sized pizzas sold from shop C is 20% of the number of small sized pizzas sold, then find the total number of pizzas sold from shop C.
View SolutionDirections: Study the following information carefully to answer the given questions: #6BG@IL73HA%©DFKE8JQ1 *VTU2$W
In the following question, select the related letters from the given alternatives. B G : L 7 : : A % : ?
View SolutionStudy the following pie-chart carefully and answer the questions given below :-
Survey conducted on 12000 people of various professionals and percentage of female professionals
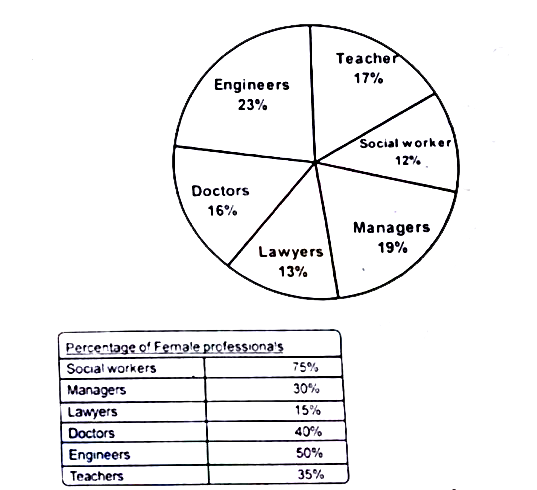
The total number of engineers is approximate what percent of the total number of Lawyers in the town ?
View Solution
