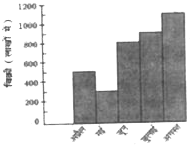
निम्नलिखित दंड आरेख में किसी डिपार्टमेन्टल स्टोर की चालू वर्ष में अप्रैल से अगस्त तक मदों की बिक्री (लाख में) दिखाई गई है। ग्राफ का अध्ययन करें और दिए गए आंकड़ों का प्रयोग करते हुए निम्नलिखित प्रश्न का उत्तर दें।

औसत मासिक बिक्री (लाख में) है:
600
650
720
780
The correct Answer is:C
Step by step video, text & image solution for निम्नलिखित दंड आरेख में किसी डिपार्टमेन्टल स्टोर की चालू वर्ष में अप्रैल से अगस्त तक मदों की बिक्री (लाख में) दिखाई गई है। ग्राफ का अध्ययन करें और दिए गए आंकड़ों का प्रयोग करते हुए निम्नलिखित प्रश्न का उत्तर दें। औसत मासिक बिक्री (लाख में) है: by Maths experts to help you in doubts & scoring excellent marks in Class 14 exams.
Updated on:21/07/2023Similar Questions
The following graph shows the sales of cars (in thousands) in four cities in 4 years. Study the graph and answer the questions.
निम्नलिखित आरेख 4 वर्षों में चार शहरों में कारों की बिक्री (हज़ार में) को दर्शाता है। इस आरेख का अध्ययन कीजिए तथा प्रश्नों के उत्तर दीजिए। In 2019, what is the average number of sales among all the four cities?
2019 में, सभी चार शहरों में औसत बिक्री कितनी रही है?
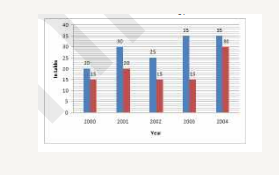
View SolutionIn the given bar graph, the Blue bar shows the income and the Red bar shows the expenditure of a company. Study the graph and answer the question that follows
दिए गए दंड आरेख में, नीला दंड एक कंपनी की आय दिखाता है और लाल दंड खर्च (लाख रुपये में) को दर्शाता है। आरेख का अध्ययन करें और उस प्रश्न का उत्तर दें जो नीचे पूछा गया है। The income in 2001 was equal to the expenditure in the year:
2001 में आय किस वर्ष के व्यय के बराबर है :
View SolutionIn the given bar graph, the Blue bar shows the income and the Red bar shows the expenditure of a company. Study the graph and answer the question that follows
दिए गए दंड आरेख में, नीला दंड एक कंपनी की आय दिखाता है और लाल दंड खर्च (लाख रुपये में) को दर्शाता है। आरेख का अध्ययन करें और उस प्रश्न का उत्तर दें जो नीचे पूछा गया है। The expenditure from 2001 to 2002 decreased by:
2001 से 2002 तक व्यय में कितनी कमी आई है?
View SolutionIn the given bar graph, the Blue bar shows the income and the Red bar shows the expenditure of a company. Study the graph and answer the question that follows
दिए गए दंड आरेख में, नीला दंड एक कंपनी की आय दिखाता है और लाल दंड खर्च (लाख रुपये में) को दर्शाता है। आरेख का अध्ययन करें और उस प्रश्न का उत्तर दें जो नीचे पूछा गया है। The percentage decrease in the income of the company in 2002 as compared to that in 2001 is:
2001 की तुलना में 2002 में कंपनी की आय में कितने प्रतिशत में कमी आई है:
View Solutionनिम्नलिखित में से 'हतभागी' का स्त्रीलिंग है
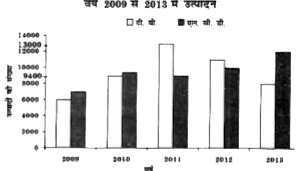
View SolutionStudy the following bar diagram carefully and answer the following questions :
निम्नलिखित आरेख का ध्यानपूर्वक अध्ययन करें और दिए गए प्रश्नों का उत्तर दें:

The ratio of production of LCDs in the year 2011 and 2013 is.
वर्ष 2011 और 2013 में एल. सी. डी. के उत्पादन का अनुपात है
View SolutionStudy the following bar diagram carefully and answer the following questions : निम्नलिखित आरेख का ध्यानपूर्वक अध्ययन करें और दिए गए प्रश्नों का उत्तर दें: The ratio of production of TVs in the years 2009 and 2010 is. वर्ष 2009 और 2010 में टी. वी. के उत्पादन का अनुपात -
View SolutionThe following figure shows the number of students (in thousands) admitted and passed out per your in a college during years 2000 to 2004, study the figure and answer the questions : : निम्नलिखित आकृति में किसी कॉलेज में वर्ष 2000 से वर्ष 2004 तक प्रति वर्ष भर्ती हुए और उर्तीण हुए छात्रों की संख्या (हजार में) दर्शायी गई है। आकृति का अध्ययन कर प्रश्नों के उत्तर दीजिए : The percent increase in the number of students admitted in the year 2003 over that in 2001 is वर्ष 2001 की तुलना में वर्ष 2003 में भर्ती हुए छात्रों की संख्या में हुई प्रतिशत वृद्धि कितनी है ?
View Solution
