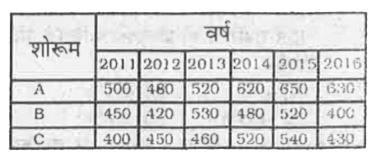
यह तालिका 6 वर्ष के दौरान विभिन्न शोरूमो में बेची गई कारों की संख्या को दर्शाती है।

यदि तीनो शोरूमों द्वारा छह वर्ष में बेची गई कारों की कुल संख्या को वृत्त आरेख (पाई -चार्ट ) के रूप में दर्शाया जाए, तो वर्ष 2013 में बेची गई कारों की कुल संख्या को प्रदर्शित करने वाले त्रिज्यखंड (सेक्टर ) का केन्द्रीय कोण क्या है ?
58∘
62∘
60∘
56∘
The correct Answer is:C
Step by step video & text solution for यह तालिका 6 वर्ष के दौरान विभिन्न शोरूमो में बेची गई कारों की संख्या को दर्शाती है। यदि तीनो शोरूमों द्वारा छह वर्ष में बेची गई कारों की कुल संख्या को वृत्त आरेख (पाई -चार्ट ) के रूप में दर्शाया जाए, तो वर्ष 2013 में बेची गई कारों की कुल संख्या को प्रदर्शित करने वाले त्रिज्यखंड (सेक्टर ) का केन्द्रीय कोण क्या है ? by Maths experts to help you in doubts & scoring excellent marks in Class 14 exams.
Updated on:21/07/2023Similar Questions
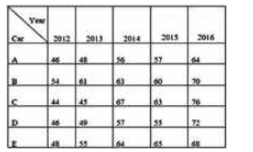
The table shows the production of different types of cars (in thousands).
यह तालिका एक कंपनी द्वारा अलग-अलग कारों के उत्पादन ( हज़ार में ) को दर्शाती है | The ratio of the total production of type A cars in 2014 and 2016 and type C cars in 2013 taken together to the total production of type B cars and type D cars taken together in 2014 is:
2014 तथा 2016 में A प्रकार एवं 2013 में C प्रकार की कारों के कुल उत्पादन ( संयुक्त रूप से ) का 2014 में B प्रकार और D प्रकार की कारों के कुल उत्पादन के साथ अनुपात ज्ञात करें |
View SolutionThe table shows the production of different types of cars (in thousands).
यह तालिका एक कंपनी द्वारा अलग-अलग कारों के उत्पादन (हज़ार में ) को दर्शाती है | If the data related to the production of type C cars is represented by a pie-chart, then the central angle of the sector representing production of cars in 2012 will be:
यदि C प्रकार की कारों के उत्पादन से संबंधित आंकड़ों को एक पाई-चार्ट में प्रस्तुत किया जाए, तो 2012 में कारों के उत्पादन को दर्शाने वाले खंड का केंद्रीय कोण होगा :
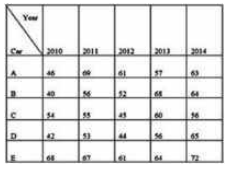
View SolutionThe table shows the production of different types of cars (in thousands).
यह तालिका एक कंपनी द्वारा अलग-अलग कारों के उत्पादन (हज़ार में ) को दर्शाती है | The total production of type A cars in 2011, and type C cars and type E cars in 2012 taken together
is what percent of the total production of type B cars during 2010 to 2014?
2011 में A प्रकार की कारों तथा 2012 में C प्रकार एवं E प्रकार की कारों का कुल उत्पादन ( सब को मिलाकर ) 2010 से 2014 के दौरान B प्रकार की कारों के कुल उत्पादन का कितना प्रतिशत है ?
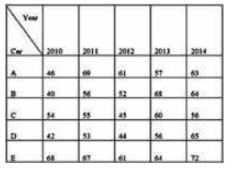
View SolutionThe table shows the production of different types of cars (in thousands). यह तालिका एक कंपनी द्वारा अलग-अलग कारों के उत्पादन (हज़ार में ) को दर्शाती है | The average production of type A cars during the five years is what percent of the total production of type C cars during the five years? पांच वर्षों के दौरान A प्रकार की कारों का औसत उत्पादन पांच वर्षों के दौरान C प्रकार की कारों के कुल उत्पादन का कितना प्रतिशत है ?
View SolutionThe table shows the production of different types of cars (in thousands). यह तालिका एक कंपनी द्वारा अलग-अलग कारों के उत्पादन (हज़ार में ) को दर्शाती है | If the data related to the production of type B cars is represented by a pie chart, then the central angle of the sector representing the production of cars in 2016 is: यदि B प्रकार की कारों के उत्पादन से संबंधित आंकड़ों को एक पाई-चार्ट में प्रस्तुत किया जाए, तो 2016 में कारों के उत्पादन को दर्शाने वाले खंड का केंद्रीय कोण होगा :
View SolutionThe table shows the number of cars sold by three showrooms over a period of six years. यह तालिका तीन शोरूम द्वारा छः वर्षों की अवधि में बेची गयी कारों की संख्या दर्शाती है | If the total number of cars sold by all three showrooms over the years is represented as a pie-chart, what is the central angle of the sector representing the total number of cars sold in the year 2013 (to the nearest whole number)? यदि तीनों शोरुम द्वारा इन वर्षों के दौरान बेची गयी कारों की कुल संख्या को एक पाई-चार्ट में प्रस्तुत किया जाए, तो वर्ष 2013 में बेची गयी कारों की कुल संख्या को दर्शाने वाले त्रिज्यखंड का केंद्रीय कोण क्या होगा? ( निकटतम पूर्ण संख्या में )
View SolutionThe table shows the number of cars sold by three showrooms over a period of six years. यह तालिका तीन शोरूम द्वारा छः वर्षों की अवधि में बेची गयी कारों की संख्या दर्शाती है | By what percent did the total number of cars sold by all three showrooms decrease during the year 2016, as compared to that in the year 2015 (nearest to one decimal place)? वर्ष 2015 की तुलना में वर्ष 2016 में तीनों शोरूम के द्वारा बेची गयी कारों की कुल संख्या में कितने प्रतिशत की कमी आयी है ? (एक दशमलव स्थान के निकटतम )
View SolutionThe table shows the number of cars sold by three showrooms over a period of six years. यह तालिका तीन शोरूम द्वारा छः वर्षों की अवधि में बेची गयी कारों की संख्या दर्शाती है | What is the average number of cars sold by showroom A over the given six years (nearest to one decimal place)? दिए गए छः वर्षों में शोरूम A द्वारा बेची गयी कारों की औसत संख्या कितनी है ? (एक दशमलव स्थान के निकटतम )
View Solution
