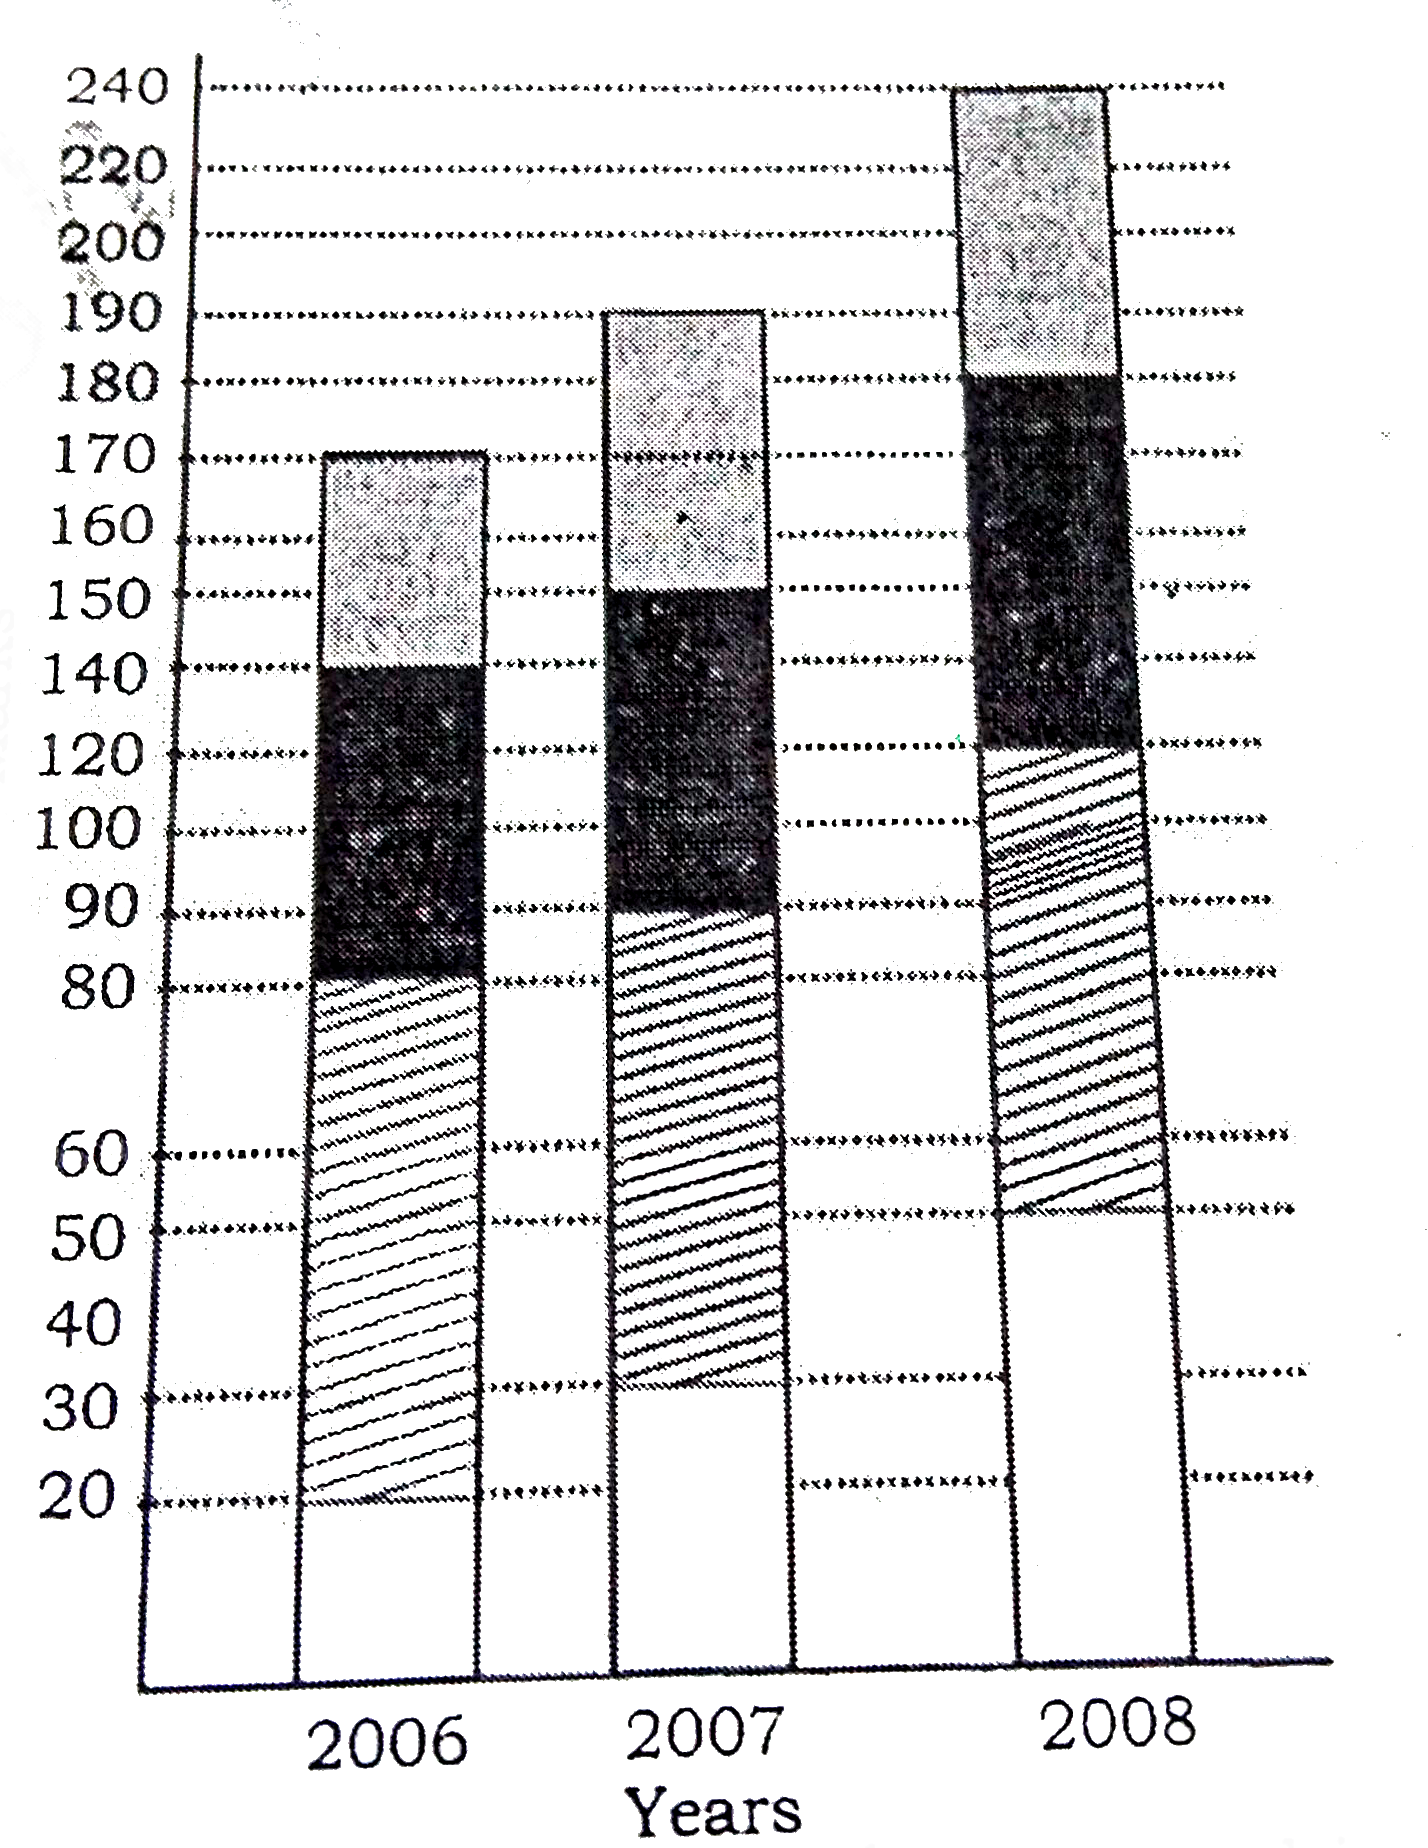
The subdivided bar diagram given below depicts the result of B com students of a college for 3 years Study the graph and answer the given questions

वर्ष 2006 में तृतीय श्रेणी से उत्तीर्ण होने वालो छात्रों की संख्या बताये ।
The correct Answer is:A
Step by step video, text & image solution for The subdivided bar diagram given below depicts the result of B com students of a college for 3 years Study the graph and answer the given questions वर्ष 2006 में तृतीय श्रेणी से उत्तीर्ण होने वालो छात्रों की संख्या बताये । by Maths experts to help you in doubts & scoring excellent marks in Class 14 exams.
Updated on:21/07/2023Similar Questions
Match the following Column A to Column B

View SolutionFind the area of figure given below.

View SolutionFind the perimeter of the figure given below.

View SolutionFind the area of the figure given below.

View SolutionCalculate the volume of the given solid.
ltimg src="https://d10lpgp6xz60nq.cloudfront.net/physics_images/PS_MATH_VII_C06_E03_002_Q01.png" width="80%"gt
View SolutionThe area of the shaded part in the figure given below is ______.

View SolutionThe inequation represented by the graph given below is :
View SolutionThe inequation that best describes the graph given below is _________
View Solution
