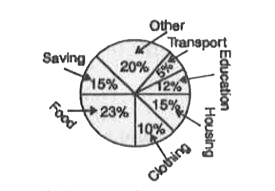
Read the following pie-chart to answer the questions given below it.
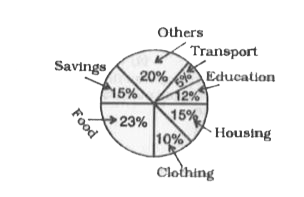
Per cent of money spent by a family on various items during 1998
Graph shows that the maximmum amount was spent on :
Food
Housing
Clothing
Others
The correct Answer is:A
Step by step video, text & image solution for Read the following pie-chart to answer the questions given below it. Per cent of money spent by a family on various items during 1998 Graph shows that the maximmum amount was spent on : by Maths experts to help you in doubts & scoring excellent marks in Class 14 exams.
Updated on:21/07/2023Topper's Solved these Questions
- STATISTICS AND DATA INTERPRETATIONBOOK - KIRAN PUBLICATIONCHAPTER - STATISTICS AND DATA INTERPRETATIONEXERCISE - TYPE-VIII
8 Videos
- STATISTICS AND DATA INTERPRETATIONBOOK - KIRAN PUBLICATIONCHAPTER - STATISTICS AND DATA INTERPRETATIONEXERCISE - TYPE-VI
86 Videos
- SIMPLIFICATIONBOOK - KIRAN PUBLICATIONCHAPTER - SIMPLIFICATIONEXERCISE - TEST YOURSELF
25 Videos
- TIME AND DISTANCEBOOK - KIRAN PUBLICATIONCHAPTER - TIME AND DISTANCEEXERCISE - Type -XI
74 Videos
Similar Questions
Read the following pie-chart to answer the questions given below it.
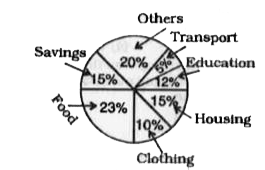
Per cent of money spent by a family on various items during 1998
If the total expenditure of the family for the year 1998 was Rs 46000/-, the family saved during the year.
View SolutionThe circle graph given here shows the spendings by a family on various items during the year 1998. Study the graph and answer the following questions.
(Per cent of money spent by a family on various items during
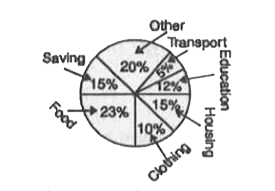
Graph shows that the maximum amount was spent on:
View Solution
Knowledge Check
Read the following pie-chart to answer the questions given below it.
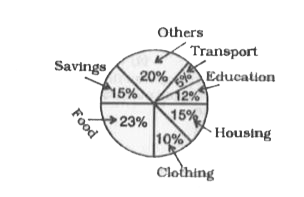
Per cent of money spent by a family on various items during 1998
The ratio of the total amount of money spent on housing to that spent on education was :A5:2B2:5C4:5D5:4Read the following pie-chart to answer the questions given below it.
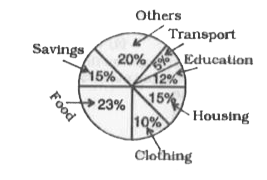
Per cent of money spent by a family on various items during 1998
If the total amount spent during the year 1998 was Rs 46000 /-, the amount spent on food, was :ARs 2000/-BRs 10580/-CRs 23000/-DRs 2300/-Read the following pie-chart to answer the questions given below it.
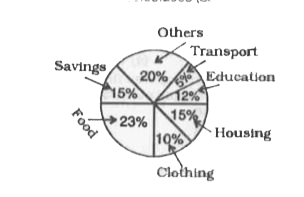
Per cent of money spent by a family on various items during 1998
If the total amount spent was Rs 46000/-, how much was spent on clothing and housing together?ARs 11500/-BRs 1150/-CRs 10000/-DRs 15000/-
The circle graph given here shows the spendings by a family on various items during the year 1998. Study the graph and answer the following questions.
(Per cent of money spent by a family on various items during
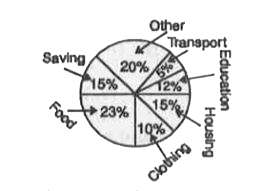
The ratio of the total amount of money spent on housing to that spent on education was :
View SolutionThe circle graph given here shows the spendings by a family on various items during the year 1998. Study the graph and answer the following questions.
(Per cent of money spent by a family on various items during
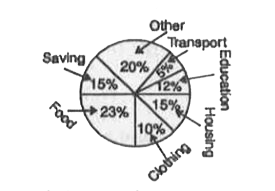
If the total amount spent was Rs. 46000/-, how much · was spent on clothing and housing together?
View SolutionThe circle graph given here shows the spendings by a family on various items during the year 1998. Study the graph and answer the following questions.
(Per cent of money spent by a family on various items during
If the total amount spent during the year 1998 was Rs. 46000/-, the amount spent on food, was :
View SolutionThe circle graph given here shows the spendings by a family on various items during the year 1998. Study the graph and answer the following questions.
(Per cent of money spent by a family on various items during
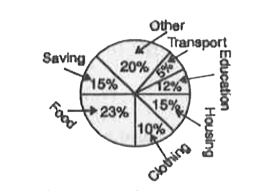
If the total expenditure of the family for the year 1998 was Rs. 46000/-, the family saved during the year.
View SolutionThe circle graph given here shows the spendings of a country on various sports during a particular year, study the graph carefully and answer the questions given below it.
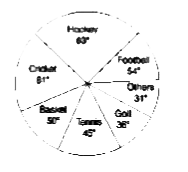
If the total amount spent on sports during the year was Rs 72 crore, the amount spent on circket exceed that on hockey by
View Solution
