A graph showing the price of rice in India during the year 2000 to 2003 is given below. Study the graph carefully and answer the questions.
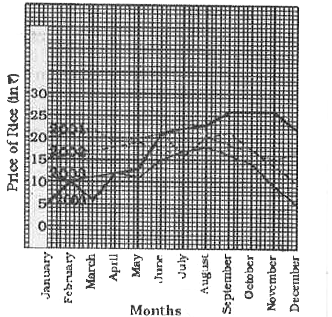
The month in which the price of rice were equal for the year 2000 and 2001 was
September
August
June
November
The correct Answer is:C
Step by step video, text & image solution for A graph showing the price of rice in India during the year 2000 to 2003 is given below. Study the graph carefully and answer the questions. The month in which the price of rice were equal for the year 2000 and 2001 was by Maths experts to help you in doubts & scoring excellent marks in Class 14 exams.
Updated on:21/07/2023Topper's Solved these Questions
- STATISTICS AND DATA INTERPRETATIONBOOK - KIRAN PUBLICATIONCHAPTER - STATISTICS AND DATA INTERPRETATIONEXERCISE - TYPE-VII
363 Videos
- STATISTICS AND DATA INTERPRETATIONBOOK - KIRAN PUBLICATIONCHAPTER - STATISTICS AND DATA INTERPRETATIONEXERCISE - TYPE-VIII
8 Videos
- STATISTICS AND DATA INTERPRETATIONBOOK - KIRAN PUBLICATIONCHAPTER - STATISTICS AND DATA INTERPRETATIONEXERCISE - TYPE-V
38 Videos
- SIMPLIFICATIONBOOK - KIRAN PUBLICATIONCHAPTER - SIMPLIFICATIONEXERCISE - TEST YOURSELF
25 Videos
- TIME AND DISTANCEBOOK - KIRAN PUBLICATIONCHAPTER - TIME AND DISTANCEEXERCISE - Type -XI
74 Videos
Similar Questions
Following graph shows the income of a company in six different years. Study the graph , carefully and answer the questions that follow.
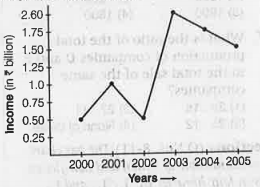
What is the ratio of the income of the company in the years 2000 and 2005 ?
View SolutionFollowing graph shows the income of a company in six different years. Study the graph , carefully and answer the questions that follow.
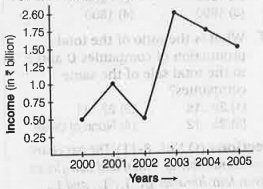
In which year income of the company is the highest?
View Solution
Knowledge Check
A graph showing the price of rice in India during the year 2000 to 2003 is given below. Study the graph carefully and answer the questions.
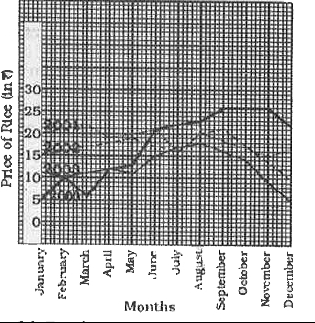
For the month of May, the graph shows that the price of rice was the lowest in the yearA2000B2001C2002D2003A graph showing the price of rice in India during the year 2000 to 2003 is given below. Study the graph carefully and answer the questions.
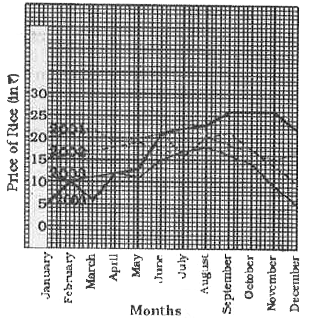
The maximum difference in price between any two years was in the month ofAJanuaryBNovemberCMarchDDecemberA graph showing the price of rice in India during the year 2000 to 2003 is given below. Study the graph carefully and answer the questions.
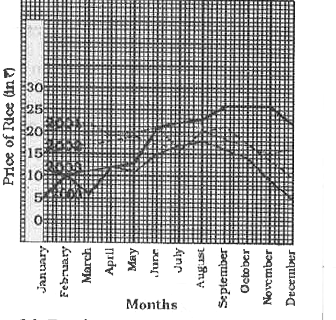
The range of price for a year is the difference between the maximmum and the minimum prices for that year. The graph shows that this range of price was the greatest for the yearA2000B2001C2002D2003
Read the following graph carefully and answer the questions given below:
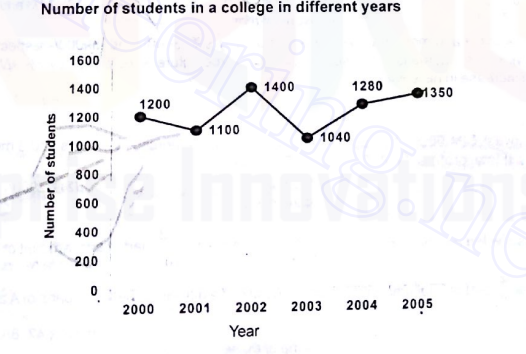
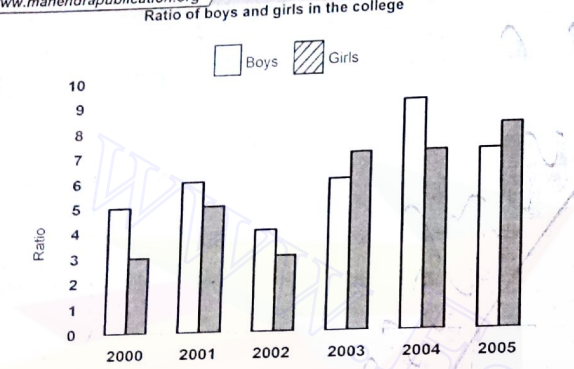
In which two years the number of girls is equal ?
View SolutionStudy the graph carefully and answer the following questions.
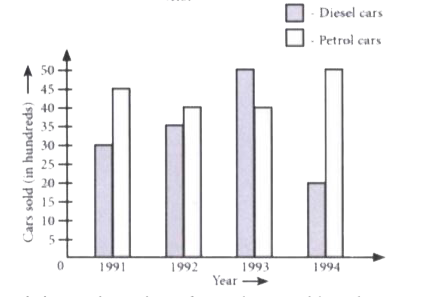
How many cars were sold during the year 1991?
View SolutionStudy the graph carefully and answer the questions below it -----
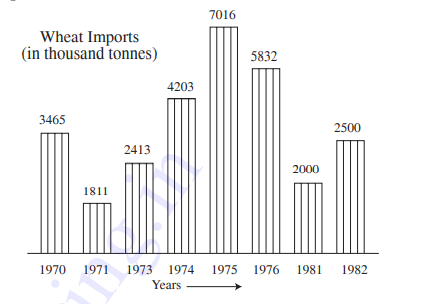
The imports in 1976 was approximately how many times that of the year 1971 ?
View SolutionStudy the graph carefully and answer the questions below it -----
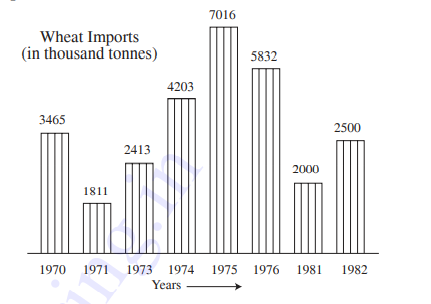
In which year did the imports register highest increase over its preceding year ?
View SolutionObserve the graph below and answer the following question.
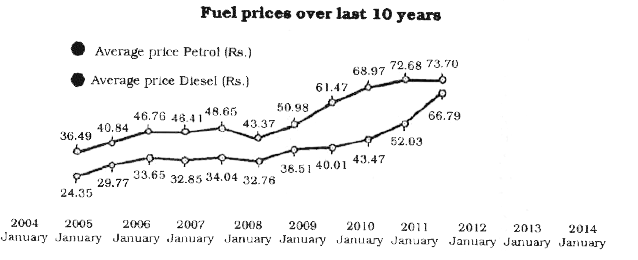
What is the average of diesel prices over the years 2006-2012?
View Solution
