The following bar diagram shows the percentage of Hindus, Sikhs and Muslims in a state during the years from 2004 o 2007. Examine the bar diagram and answer the following questions.
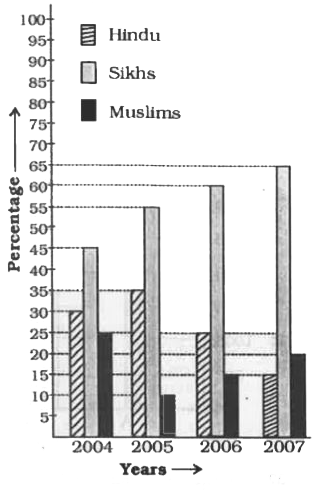
The ratio between the Hindus and Sikhs population in 2004 was
3:5
1:2
2:3
3:4
The correct Answer is:C
Step by step video, text & image solution for The following bar diagram shows the percentage of Hindus, Sikhs and Muslims in a state during the years from 2004 o 2007. Examine the bar diagram and answer the following questions. The ratio between the Hindus and Sikhs population in 2004 was by Maths experts to help you in doubts & scoring excellent marks in Class 14 exams.
Updated on:21/07/2023Topper's Solved these Questions
- STATISTICS AND DATA INTERPRETATIONBOOK - KIRAN PUBLICATIONCHAPTER - STATISTICS AND DATA INTERPRETATIONEXERCISE - TYPE-V
38 Videos
- STATISTICS AND DATA INTERPRETATIONBOOK - KIRAN PUBLICATIONCHAPTER - STATISTICS AND DATA INTERPRETATIONEXERCISE - TYPE-VI
86 Videos
- STATISTICS AND DATA INTERPRETATIONBOOK - KIRAN PUBLICATIONCHAPTER - STATISTICS AND DATA INTERPRETATIONEXERCISE - TYPE-III
39 Videos
- SIMPLIFICATIONBOOK - KIRAN PUBLICATIONCHAPTER - SIMPLIFICATIONEXERCISE - TEST YOURSELF
25 Videos
- TIME AND DISTANCEBOOK - KIRAN PUBLICATIONCHAPTER - TIME AND DISTANCEEXERCISE - Type -XI
74 Videos
Similar Questions
The following bar diagram shows the percentage of Hindus, Sikhs and Muslims in a state during the years from 2004 o 2007. Examine the bar diagram and answer the following questions.
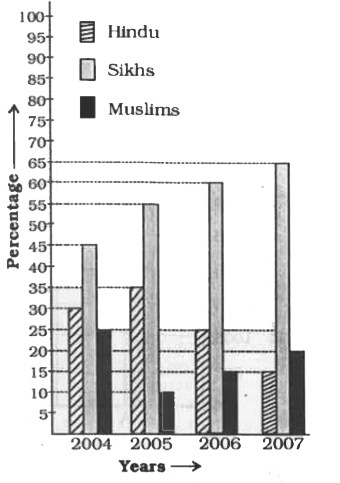
If the total population of the state in 2005 was 5 million, then the Hindu population was [1 million = 10,00,000]
View SolutionThe following bar diagram shows the percentage of Hindus, Sikhs and Muslims in a state during the years from 2004 to 2007 . Examine the bar diagram and answer the following questions .
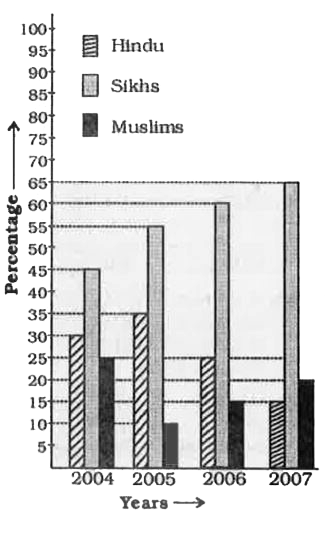
If the total population of the state in 2005 was 5 million. then the Hindu population was [1 million = 10,00,000]
View Solution
Knowledge Check
The following bar diagram shows the percentage of Hindus, Sikhs and Muslims in a state during the years from 2004 to 2007 . Examine the bar diagram and answer the following questions .
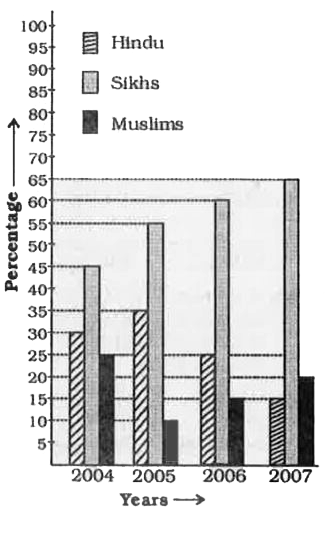
The ratio between the Hindus and Sikh populations in 2004 wasA3:5B1:2C2:3D3:4The following bar diagram shows the percentage of Hindus, Sikhs and Muslims in a state during the years from 2004 o 2007. Examine the bar diagram and answer the following questions.
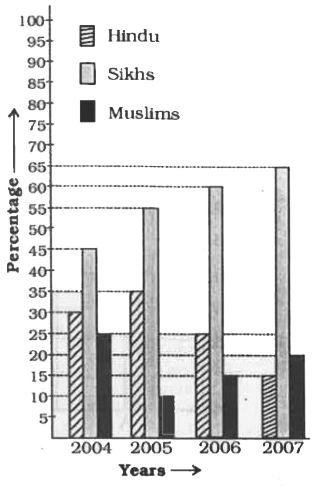
If the total population of the state in 2004 was 5 lakhs, then the Hindus and Muslims population in that year wasA200000B275000C250000D225000The following bar diagram shows the percentage of Hindus, Sikhs and Muslims in a state during the years from 2004 to 2007 . Examine the bar diagram and answer the following questions .
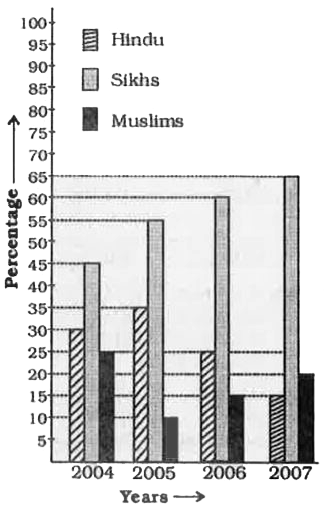
If the total population of the state in 2004 was 5 lakhs, then the Hindu and Muslim population in that year wasA200000B275000C250000D225000
Given below is a bar diagram showing the percentage of Hindus, Sikhs and muslims in a state during the years 1989 to 1992.
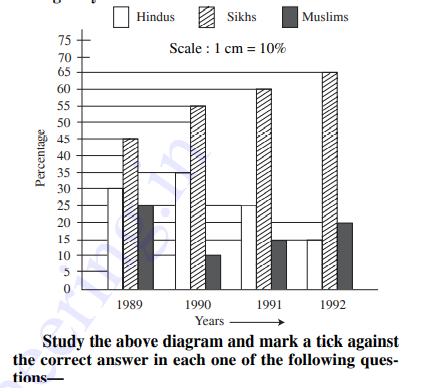
During which year was the hindu percentage maximum ?
View SolutionGiven below is a bar diagram showing the percentage of Hindus, Sikhs and muslims in a state during the years 1989 to 1992.
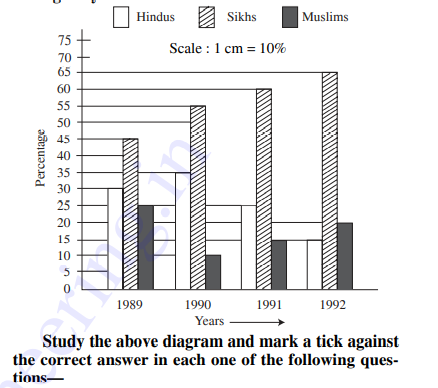
what was the percentage of sikhs over hindus in 1991 ?
View SolutionGiven below is a bar diagram showing the percentage of Hindus, Sikhs and muslims in a state during the years 1989 to 1992.
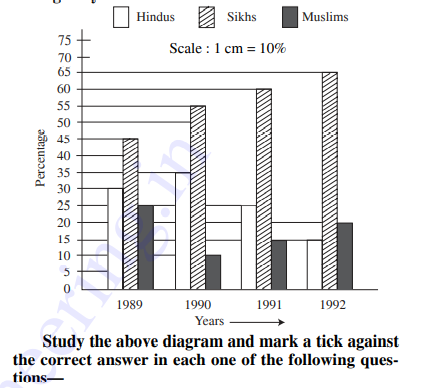
The ratio between hindus and sikhs in 1989 was-----
View SolutionGiven below is a bar diagram showing the percentage of Hindus, Sikhs and muslims in a state during the years 1989 to 1992.
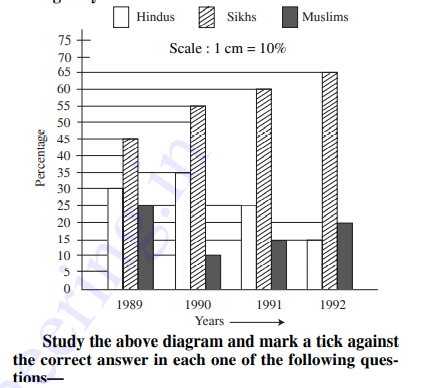
If the total population of the state in 1990 is 1 million, then the hindus population was -----
View SolutionGiven below is a bar diagram showing the percentage of Hindus, Sikhs and muslims in a state during the years 1989 to 1992.
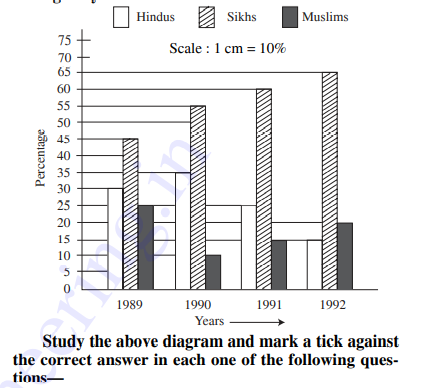
What percentage was the decrease in hindus population from 1989 to 1992 ?
View Solution
