The bar graph shows the monthly profits of the different departments of a company. Study the diagram and answer the following questions.
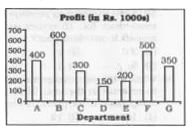
What is the ratio of the monthly profit of department G to that of department B?
12:7
7:12
5:12
12:5
The correct Answer is:B
Step by step video, text & image solution for The bar graph shows the monthly profits of the different departments of a company. Study the diagram and answer the following questions. What is the ratio of the monthly profit of department G to that of department B? by Maths experts to help you in doubts & scoring excellent marks in Class 14 exams.
Updated on:21/07/2023Topper's Solved these Questions
- STATISTICS AND DATA INTERPRETATIONBOOK - KIRAN PUBLICATIONCHAPTER - STATISTICS AND DATA INTERPRETATIONEXERCISE - TYPE-III
39 Videos
- STATISTICS AND DATA INTERPRETATIONBOOK - KIRAN PUBLICATIONCHAPTER - STATISTICS AND DATA INTERPRETATIONEXERCISE - TYPE-IV
182 Videos
- STATISTICS AND DATA INTERPRETATIONBOOK - KIRAN PUBLICATIONCHAPTER - STATISTICS AND DATA INTERPRETATIONEXERCISE - TYPE-VIII
8 Videos
- SIMPLIFICATIONBOOK - KIRAN PUBLICATIONCHAPTER - SIMPLIFICATIONEXERCISE - TEST YOURSELF
25 Videos
- TIME AND DISTANCEBOOK - KIRAN PUBLICATIONCHAPTER - TIME AND DISTANCEEXERCISE - Type -XI
74 Videos
Similar Questions
The bar graph shows the monthly profits of the different departments of a company. Study the diagram and answer the following question.
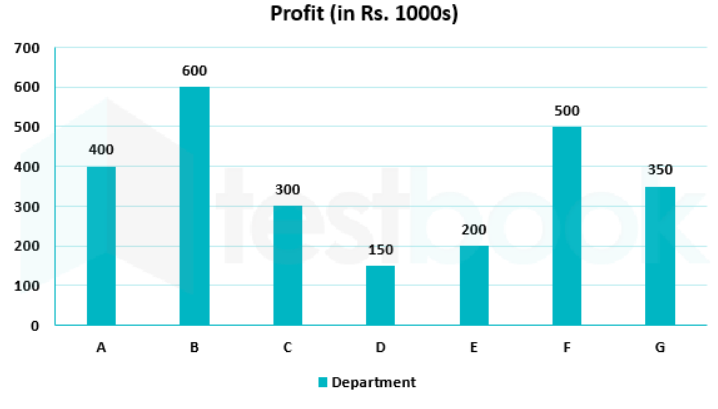
Which department has the second lowest monthly profits?
View SolutionThe bar graph shows the monthly profits of the different departments of a company. Study the diagram and answer the following question.

The monthly profit of department B is greater than that of department F by ___________.
View Solution
Knowledge Check
The bar graph shows the monthly profits of the different departments of a company. Study the diagram and answer the following questions.
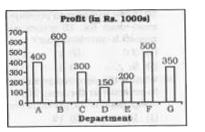
The monthly profit of department B is greater than that of department F by _____.A25%B30%C33.3%D20%The bar graph shows the annual sales of the different departments of a company. Study the diagram and answer the following questions.
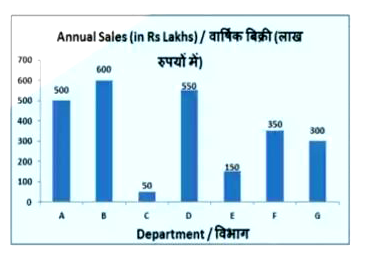
What is the ratio of the annual sales of department B to that of department F ?A12:7B7:12C12:5D5:12The bar graph shows the monthly profits of the different departments of a company. Study the diagram and answer the following questions.
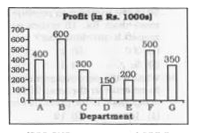
Which department has the second lowest monthly profit?ACBDCEDG
The bar graph shows the production of the different departments of a company. Study the diagram and answer the following questions.
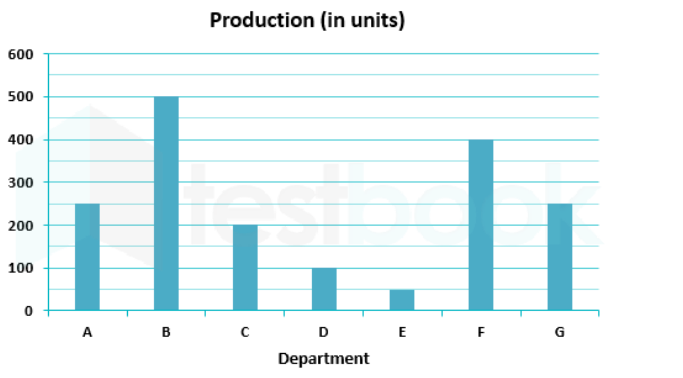
What is the ratio of production of department A to that of department F?
View SolutionThe bar graph shows the number of employees working in the different departments of a company. Study the diagram and answer the following questions.
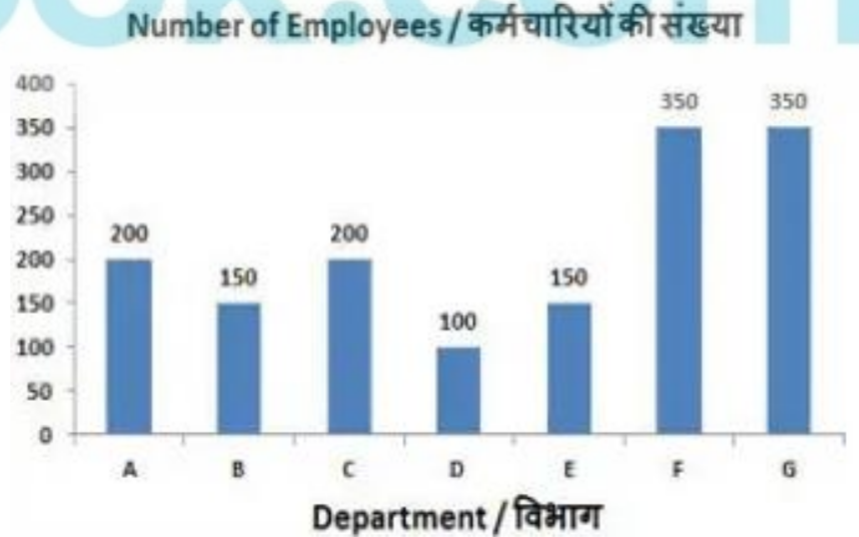
What is the ratio of number of employees of department A to that of department F?
View SolutionThe bar graph shows the monthly profits of the different departments of a company. Study the diagram and answer the following questions.
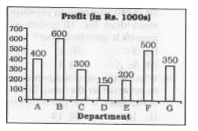
If the company has only departments then what is the monthly revenue (in Rs. Lakhs) of the company if the monthly profit was 20% of the total monthly revenue of the company?
View SolutionThe bar graph shows the annual sales of the different departments of a company. Study the diagram and answer the following questions.
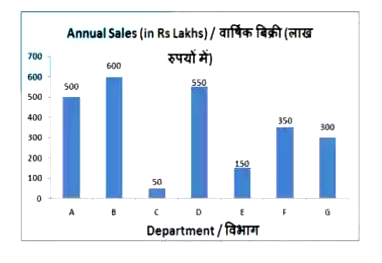
Which department has the second highest annual sales?
View SolutionThe bar graph shows the production of the different departments of a company. Study the diagram and answer the following questions.
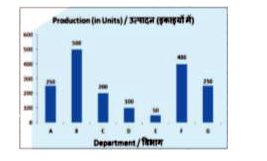
The production of department C is greater than that of department E by ____
View Solution
