The following pictograph shows different using conveyance by the students of a school:
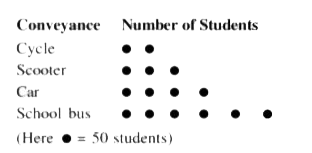
What per cent of students used school bus?
0.06
0.16
0.4
0.36
The correct Answer is:C
Step by step video, text & image solution for The following pictograph shows different using conveyance by the students of a school: What per cent of students used school bus? by Maths experts to help you in doubts & scoring excellent marks in Class 6 exams.
Updated on:21/07/2023Similar Questions
School Life of Students
View SolutionFollowing pie chart shows the degree wise distribution of the students of a school using different transport while going to school. Read the chart answer the questions carefully.
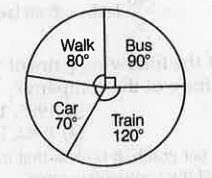
Total number of students = 2160
Find the ratio of number of students who come to school by bus and that of by car.
View Solution
Knowledge Check
The pie-chart given below represents the number of students using different transport to a school in which total number of students is 2160.
Answer the questions based on the following diagram.
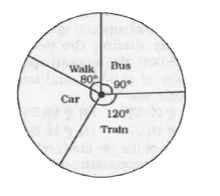
The ratio of the number of students who come to school by car to the number of students who come to school by bus isA21:24B21:27C36:27D36:21A school is a second house of a students if :
Aif its environment is like houseBIf their is food to eatCIf it help the students in all round developmentDNone of theseThe pie-chart shows the percentage-wise distribution of the number of students in five different schools P,Q,R,S and T .
The total number of students in all five schools together is 10,500 .
Study the pie -chart and answer the question .
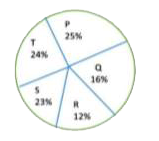
The number of students in school R is what per cent of the total number of students in schools Q and T together ?A40%B35%C25%D30%
Following pie chart shows the degree wise distribution of the students of a school using different transport while going to school. Read the chart answer the questions carefully.
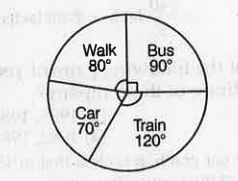
Total number of students = 2160
The number of students who come to school by car, is
View SolutionStudy the given graph the question that follows
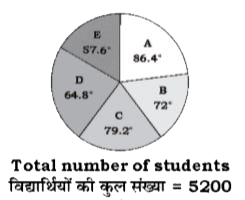
The number of students is school C is what percentage more than the number of students in school B?
View SolutionThe following table shows the interest of students of a school in different games :

Represent the data by using a simple bar diagram.
View SolutionThe given bar graph shows the number of students of two schools over a period of six years.
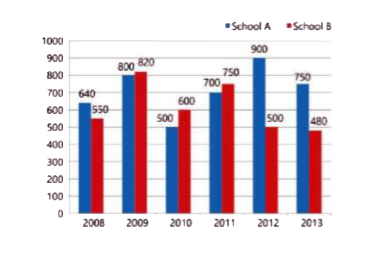
In the bar graph, what is the ratio of the average of total students from school B to the average of total students from school A?
View SolutionThe given bar graph shows the number of students of two schools over a period of six years.
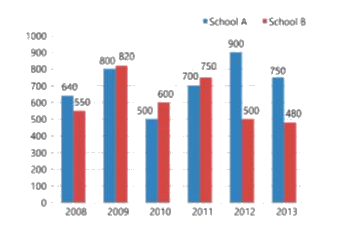
In the bar graph, what is the ratio of the average of the total students from school A to the average of the total students from school B ?
View Solution
