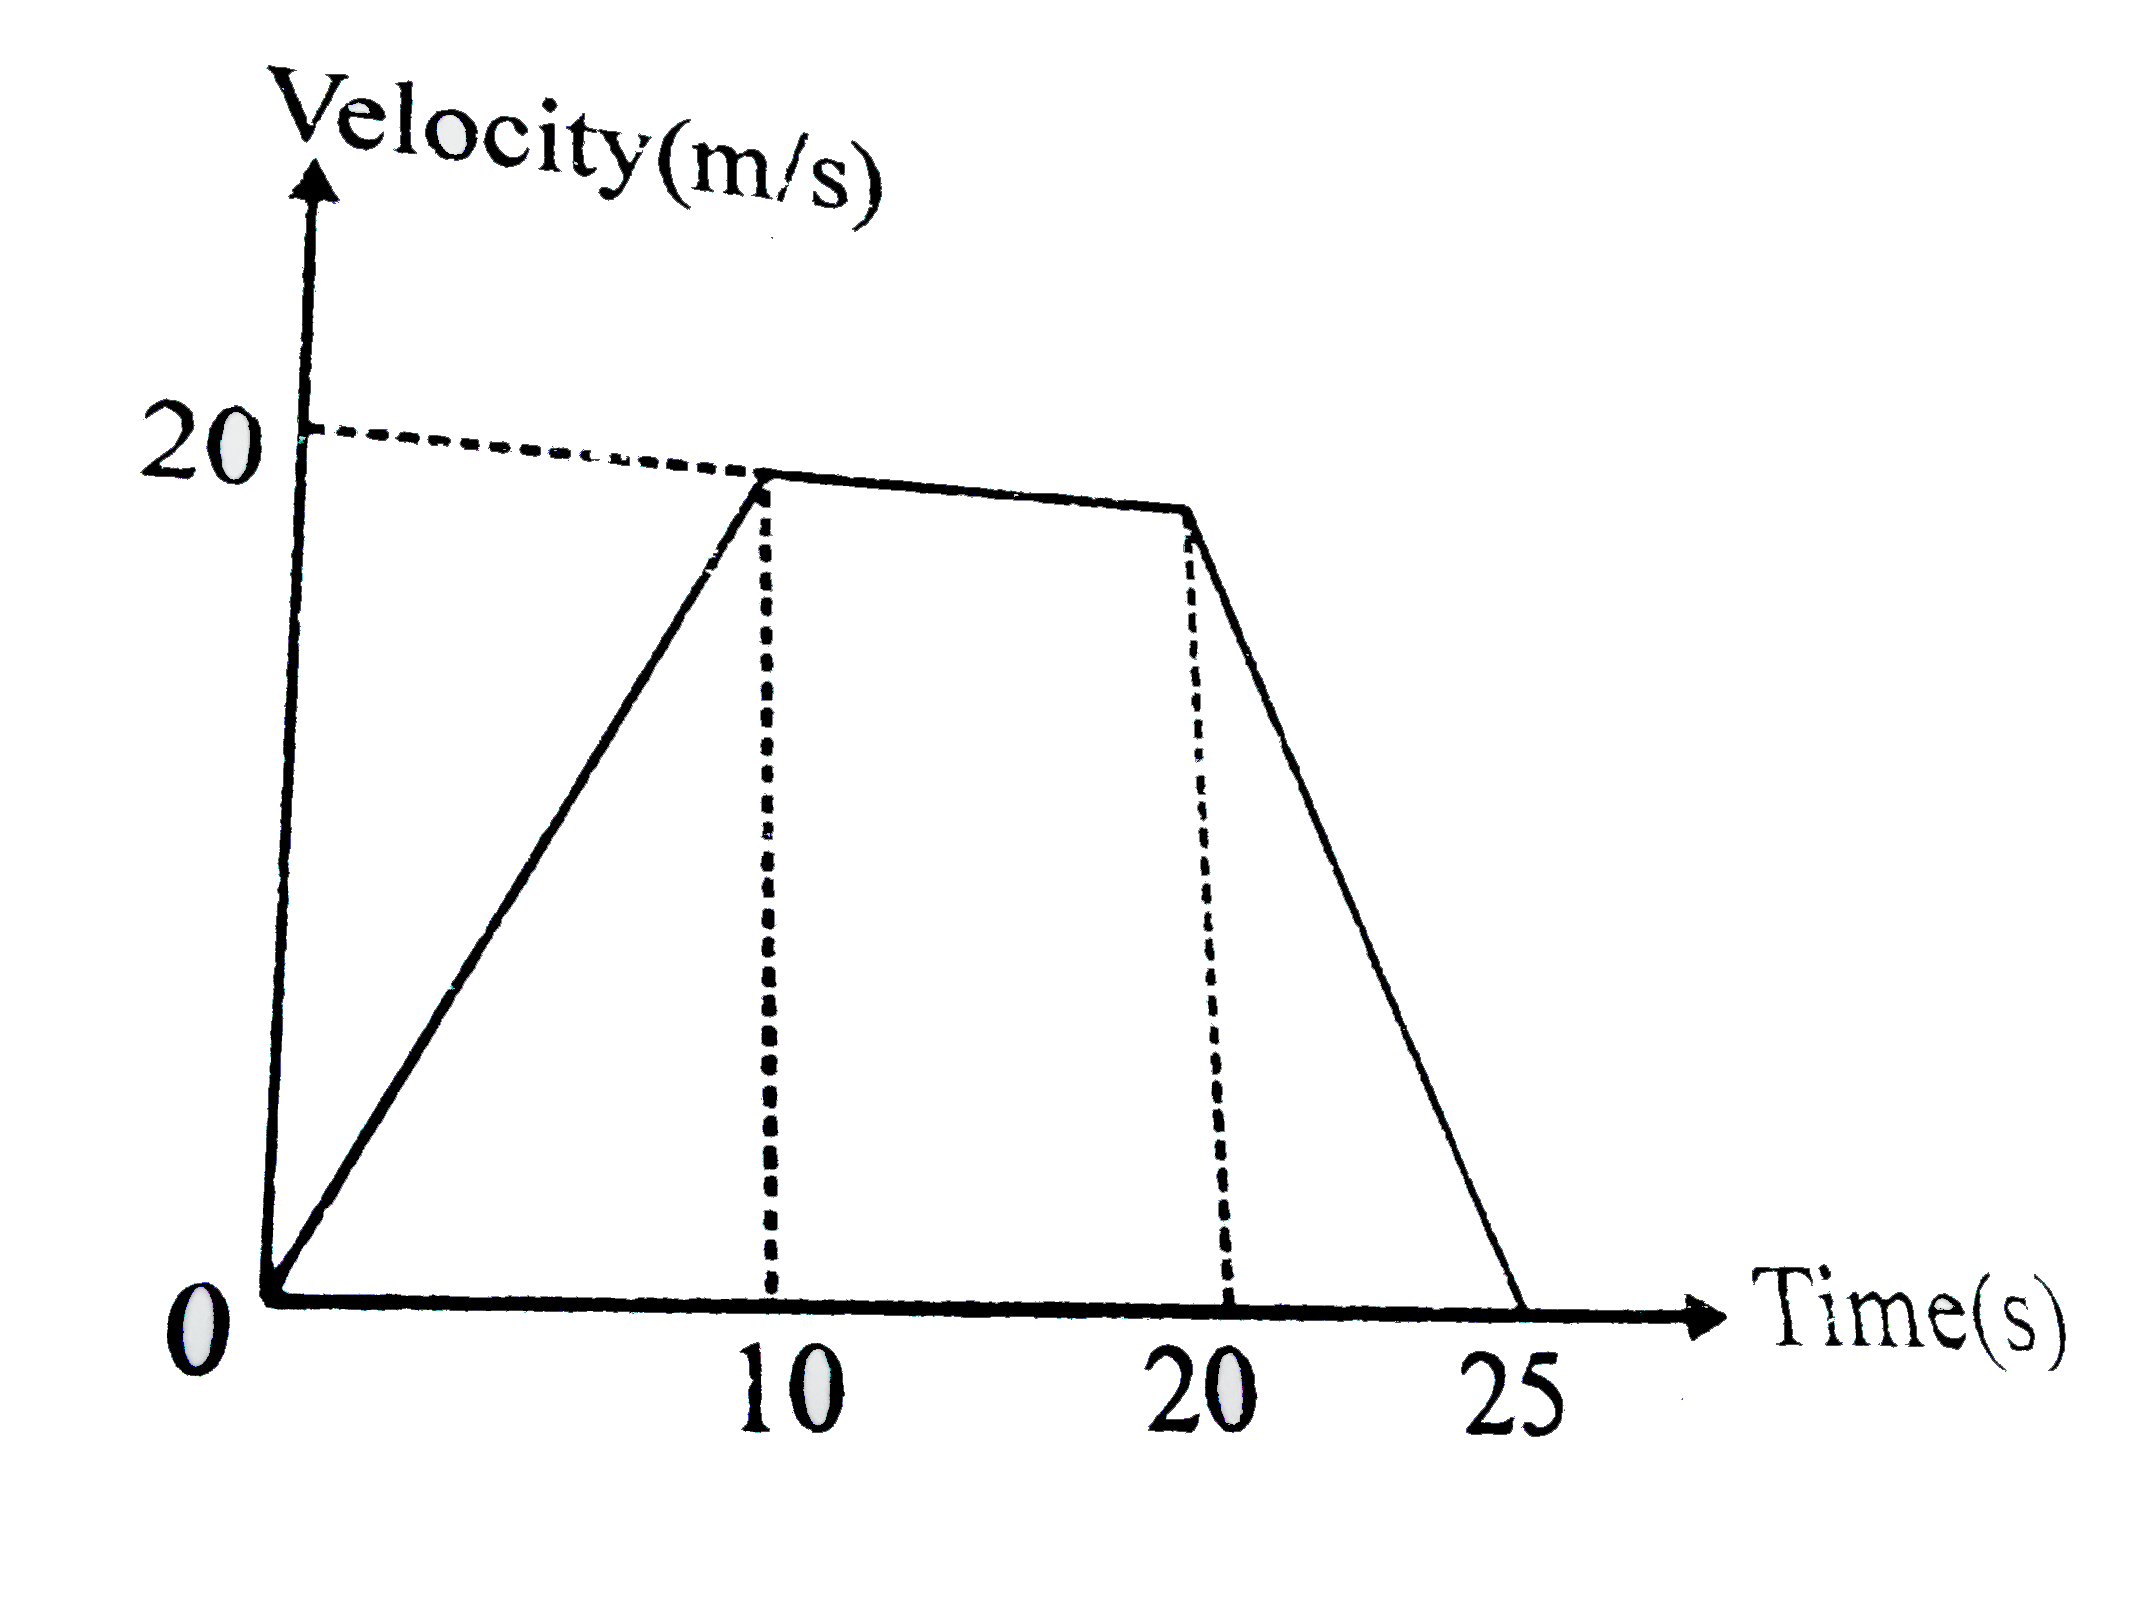
The velocity-time graph of a car moving along a straight road is shown in figure. The average velocity of the car is first 25 seconds is
20m/s
14m/s
10m/s
17.5m/s
The correct Answer is:2
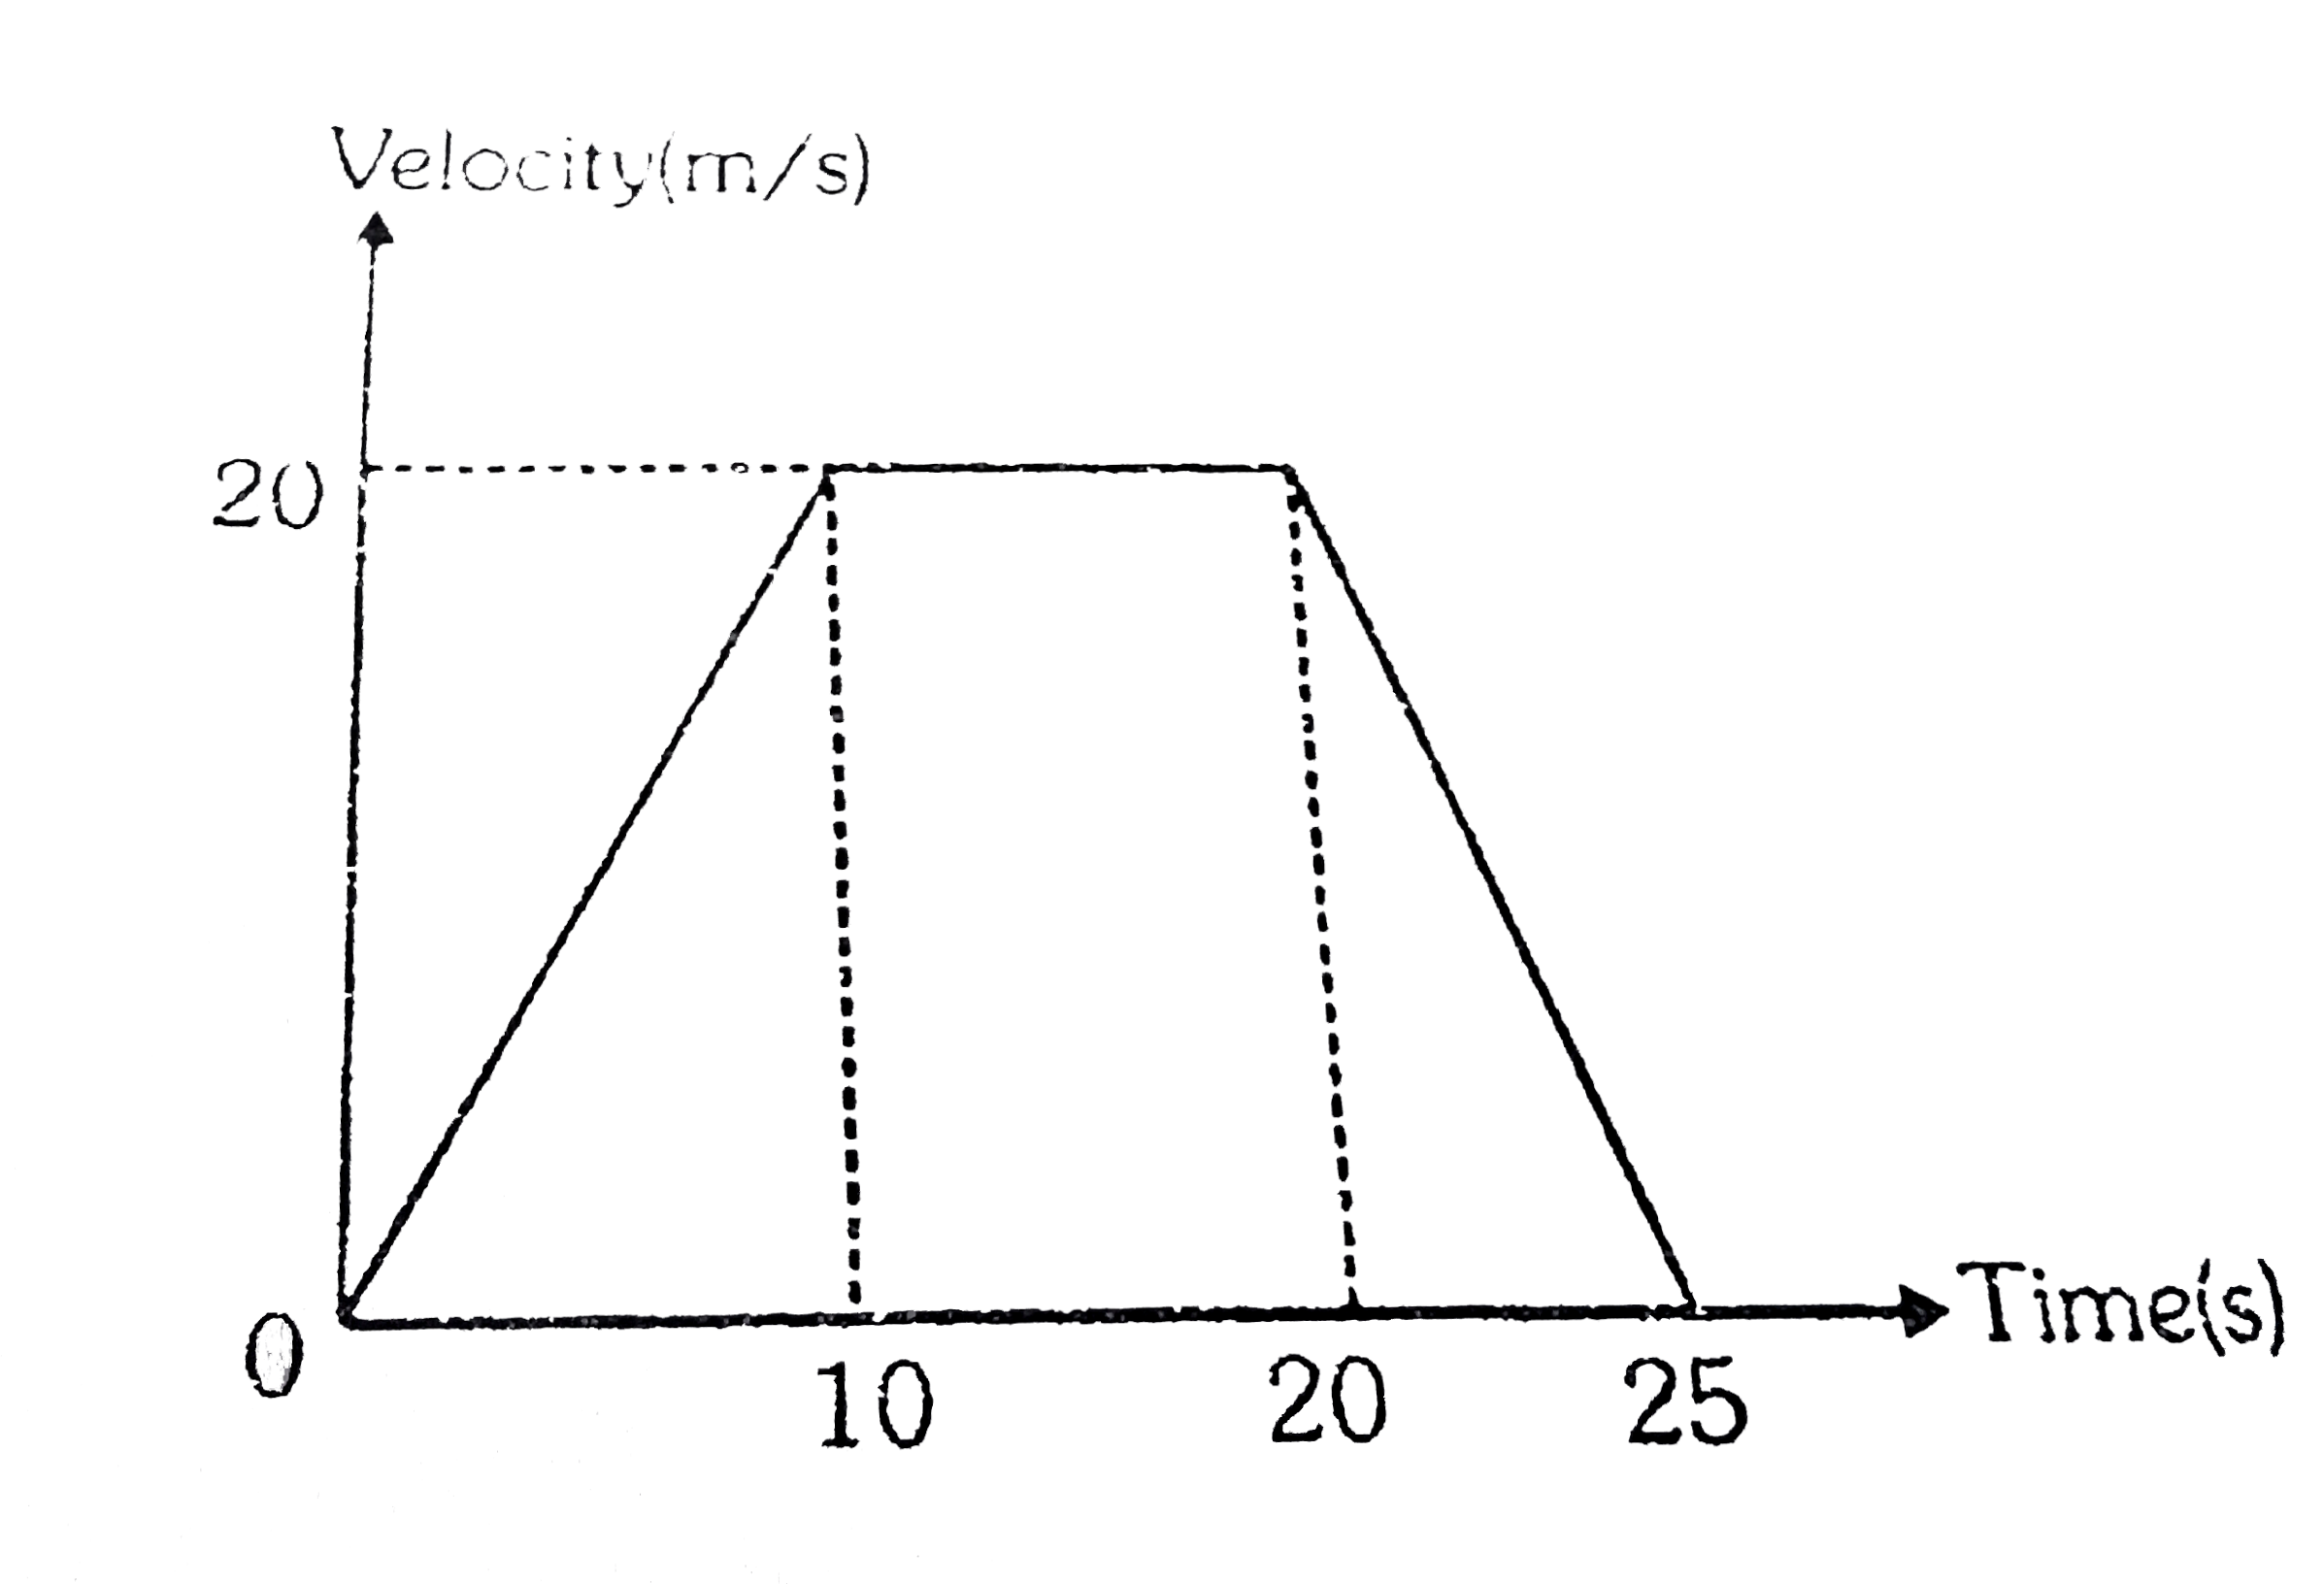
Average velocity = 25∫0vdt25−0=Area of v-t graph between t=0 to t=25 s25=125[(25+102)(20)]=14m/s
Topper's Solved these Questions
- BASIC MATHEMATICS USED IN PHYSICS &VECTORS BOOK - ALLENCHAPTER - BASIC MATHEMATICS USED IN PHYSICS &VECTORS EXERCISE - BEGINNER S BOX 1
2 Videos
- BASIC MATHEMATICS USED IN PHYSICS &VECTORS BOOK - ALLENCHAPTER - BASIC MATHEMATICS USED IN PHYSICS &VECTORS EXERCISE - BEGINNER S BOX 2
3 Videos
- CENTRE OF MASSBOOK - ALLENCHAPTER - CENTRE OF MASSEXERCISE - EXERCISE-V B
19 Videos
Similar Questions
Knowledge Check
A car moving on a straight road is an example of:
Arotatory motionBrectilinear motionCoscillatory motionDperiodic motion
The velocity time plot for a particle moving on straight line is shown in the figure.

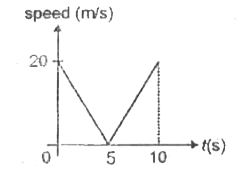
View SolutionThe speed - time graph for a body moving along a straight line is shown in figure. The average acceleration of body may be
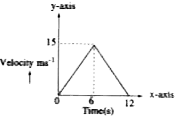
View SolutionThe velocity and time graph for a particle moving in a straight line s shown in the figure. Then, the average velocity between t=4 s and t=6 s is _____
View SolutionVelocity displacement graph of a particle moving in a straight line is as shown in figure.

View SolutionThe velocity (v)-time (t) graph of a partide moving along a straight line is as shown in the figure. The displacement of the particle from t = 0 to t = 4 is
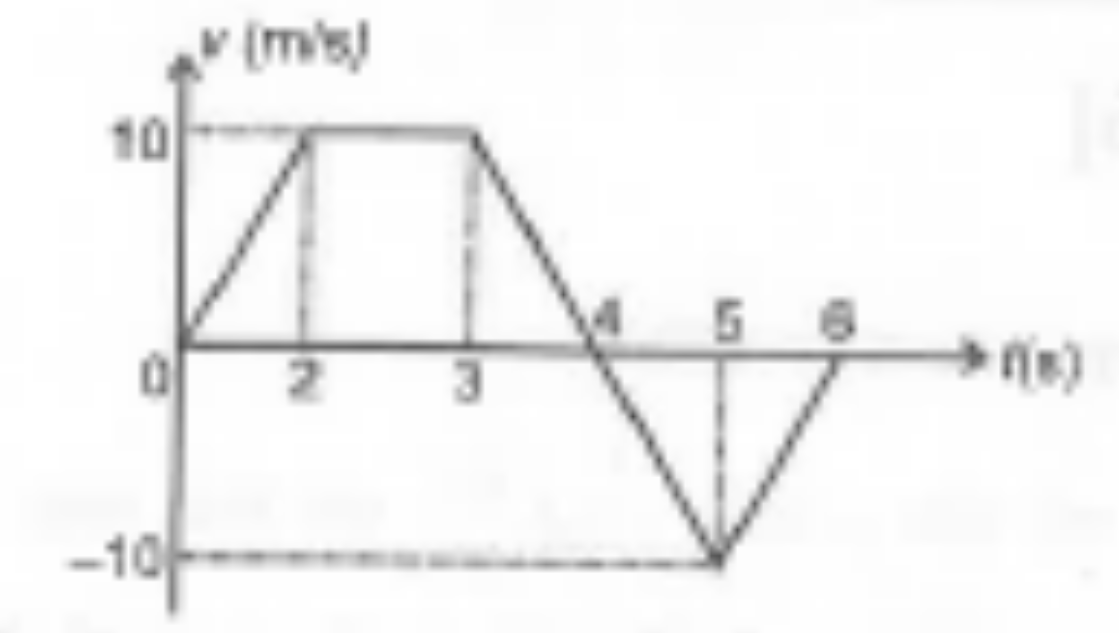
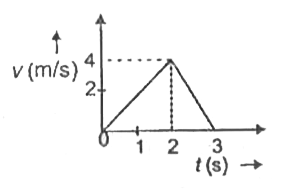
View SolutionThe velocity versus time graph of a body moving in a straight line is as shown in the figure below
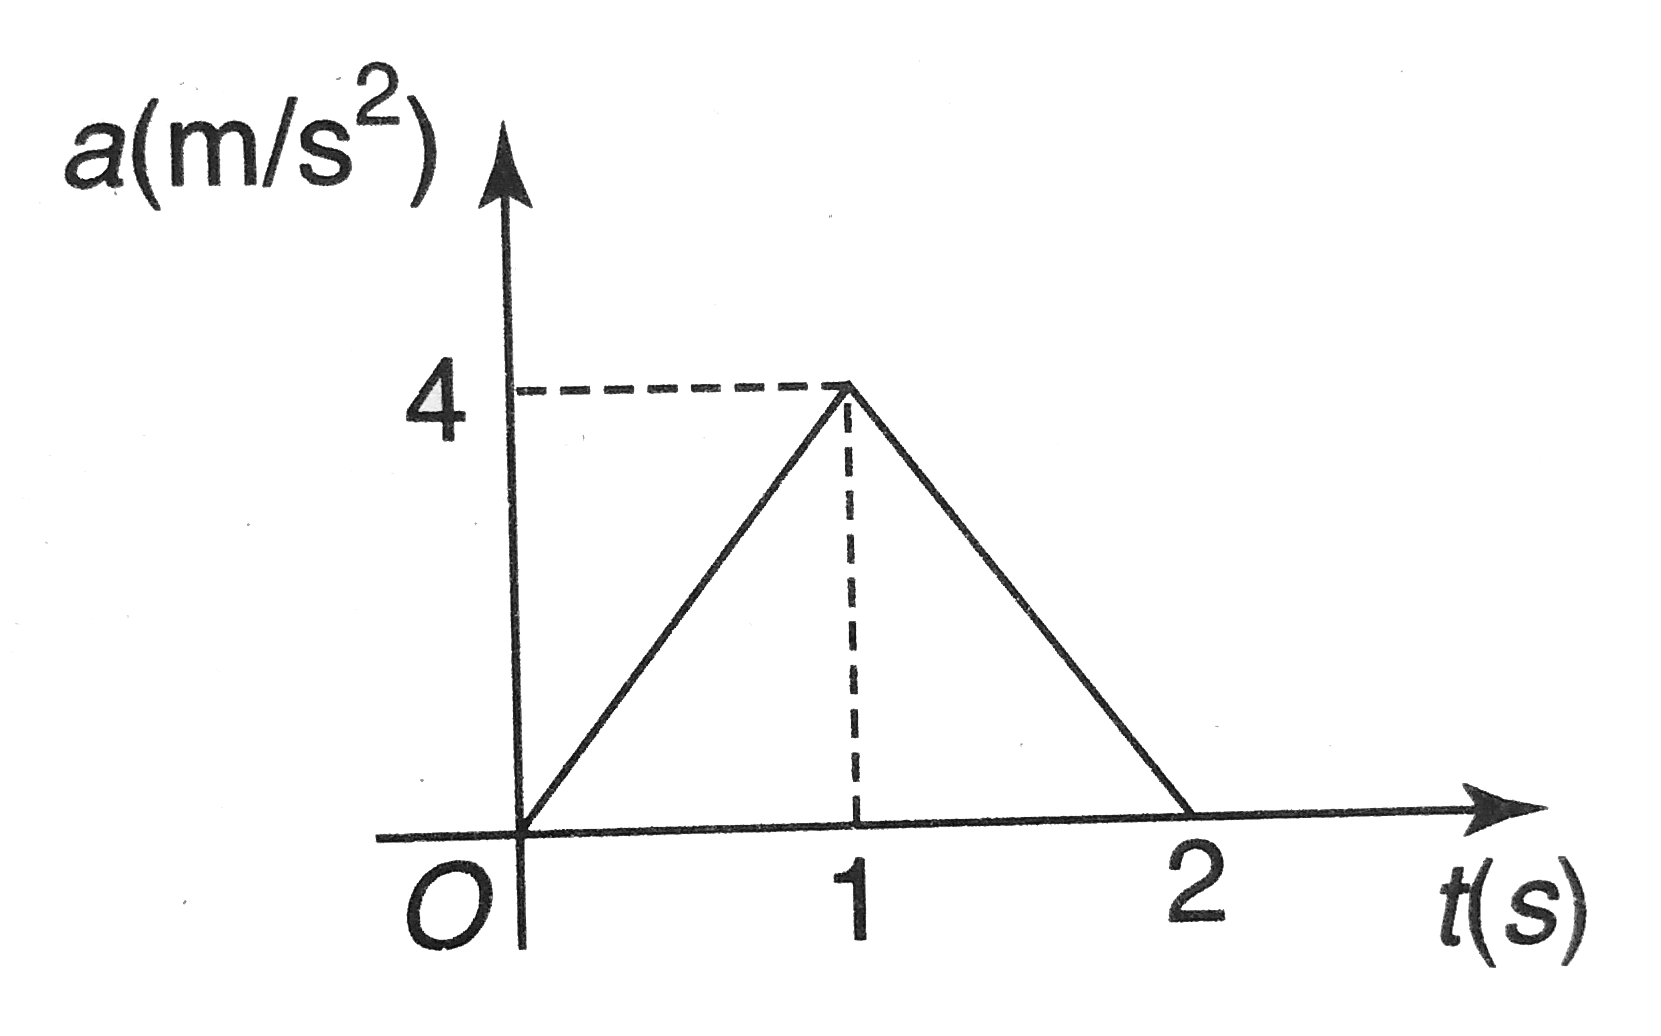
View SolutionThe acceleration-time graph of a particle moving in a straight line is as shown in figure. The velocity of the particle at time t=0 is 2m/s. The velocity after 2 seconds will be
View Solution

