Velocity - time graph of a particle moving in a straight line is shown in figure.

Plot the corresponding displacement - time graph of the particle if at time t = 0, displacement s = 0.
positive and positive respectively
positive and negative respectively
negativetive and negative respectively
negative and positive respectively
The correct Answer is:A, C
Spped increases if both velocity & acceleration have same signs.
Topper's Solved these Questions
- MOTION IN A PALNEBOOK - ALLENCHAPTER - MOTION IN A PALNEEXERCISE - EXERCISE-02
37 Videos
- MOTION IN A PALNEBOOK - ALLENCHAPTER - MOTION IN A PALNEEXERCISE - EXERCISE-03
6 Videos
- KINEMATICS-2DBOOK - ALLENCHAPTER - KINEMATICS-2DEXERCISE - Exercise (O-2)
46 Videos
- NEWTON'S LAWS OF MOTION & FRICTIONBOOK - ALLENCHAPTER - NEWTON'S LAWS OF MOTION & FRICTIONEXERCISE - EXERCISE (JA)
4 Videos
Similar Questions
Displacement time graph of a particle moving in a straight line is a shown in figure.

View SolutionVelocity displacement graph of a particle moving in a straight line is as shown in figure.

View SolutionThe velocity time plot for a particle moving on straight line is shown in the figure.
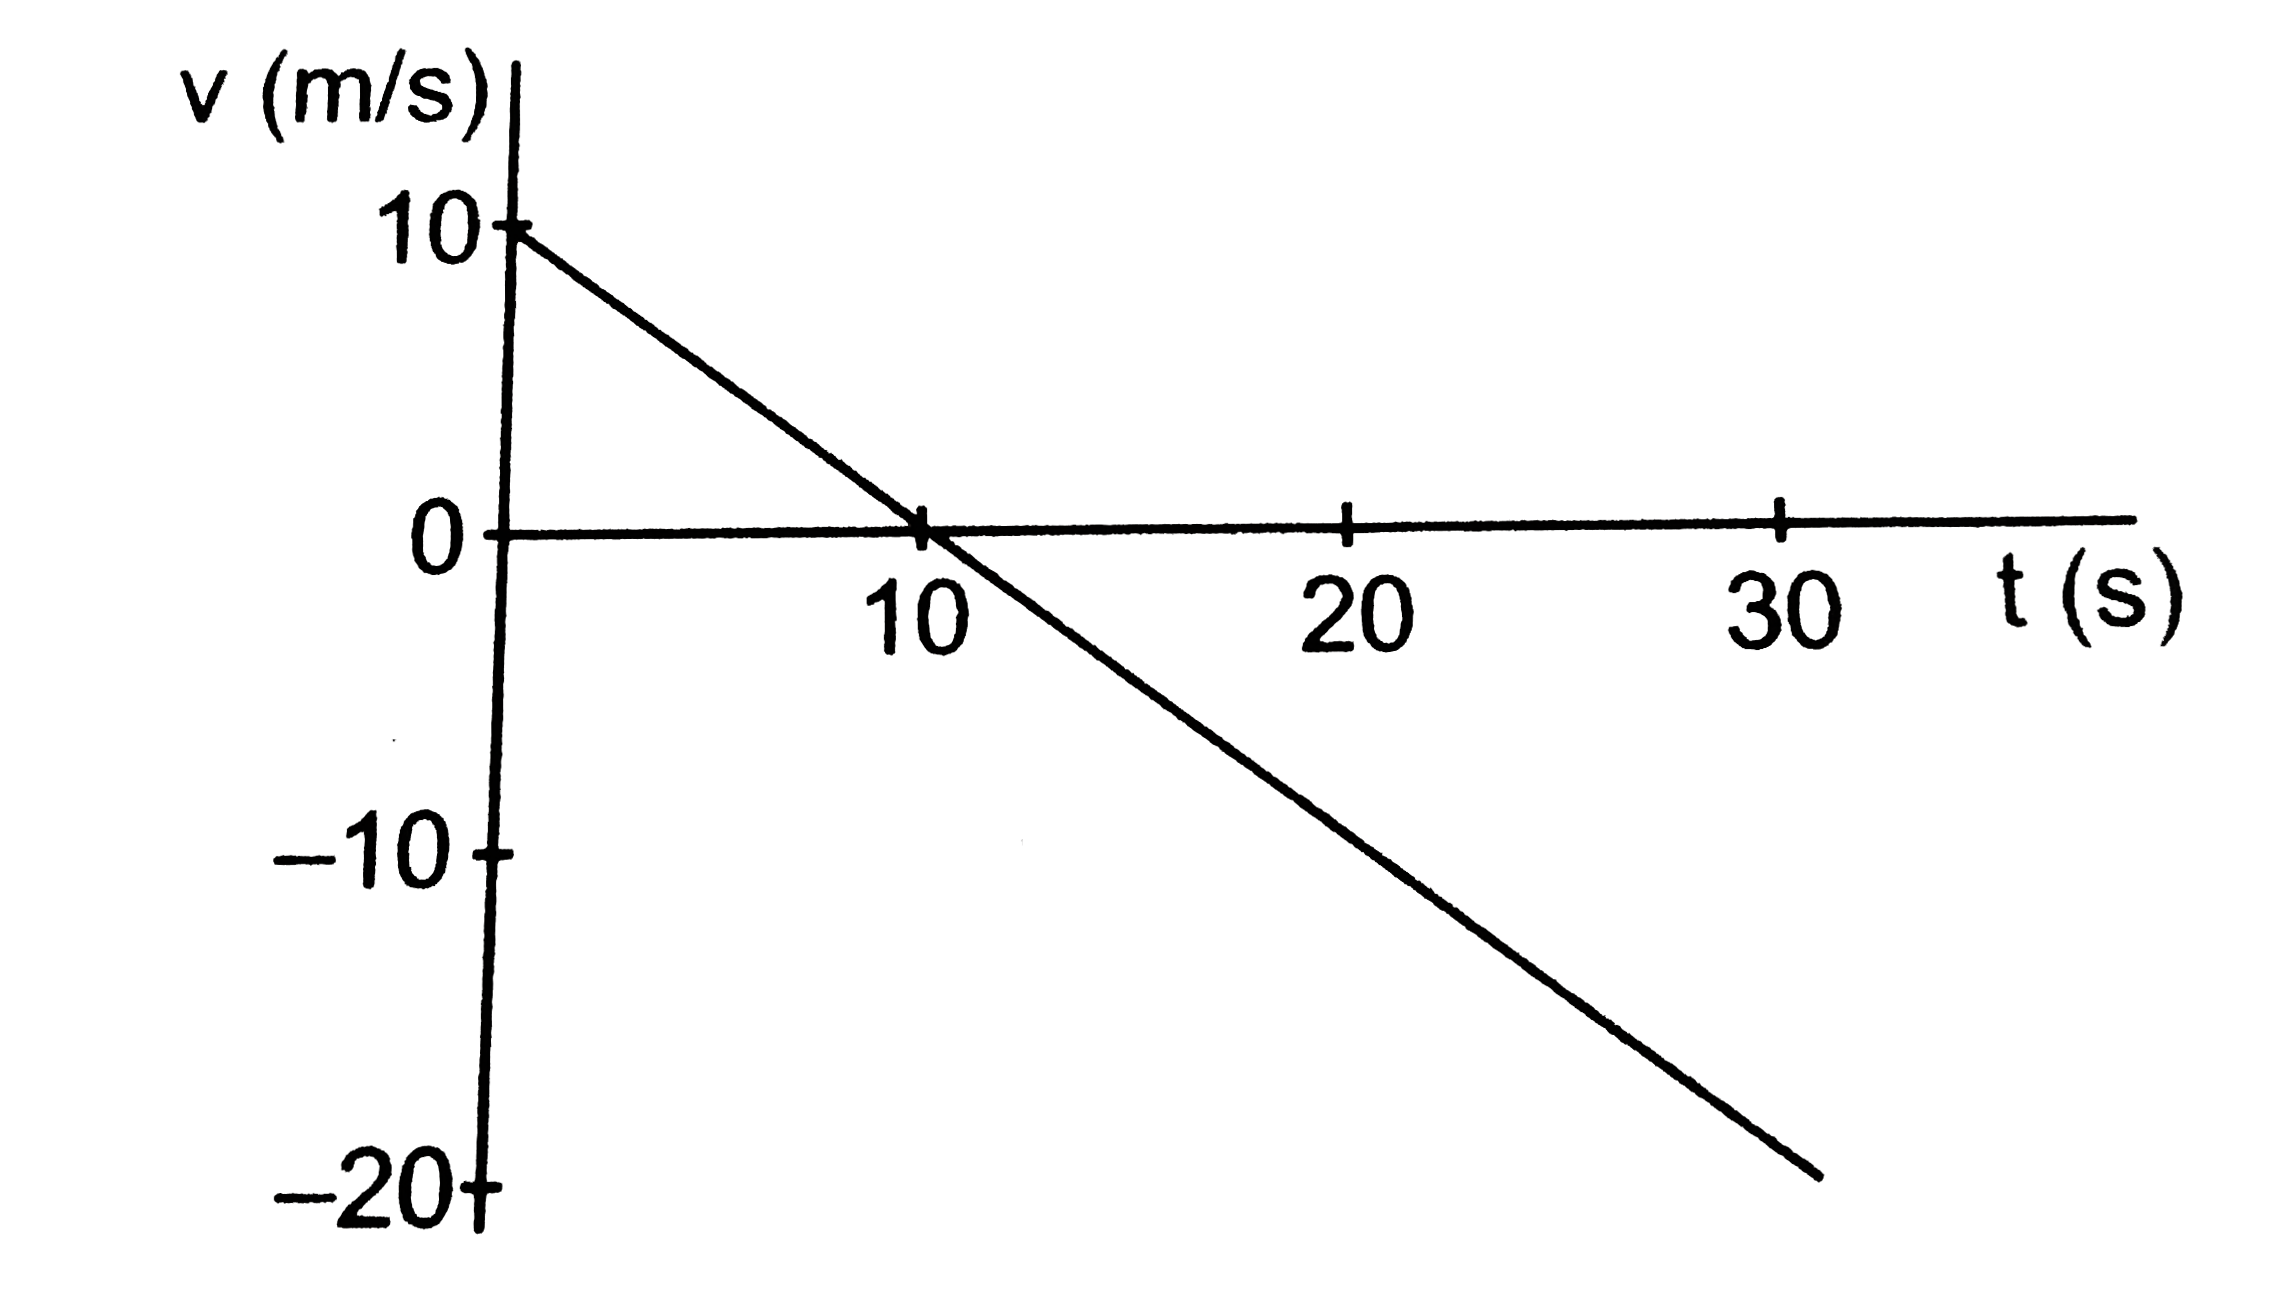
View SolutionThe velocity time plot for a particle moving on straight line is shown in the figure.

View SolutionVelocity-time graph of a particle moving in a straight line is shown in figure. At time t=0,s=−10m. Plot corresponding a-t and s-t graphs.
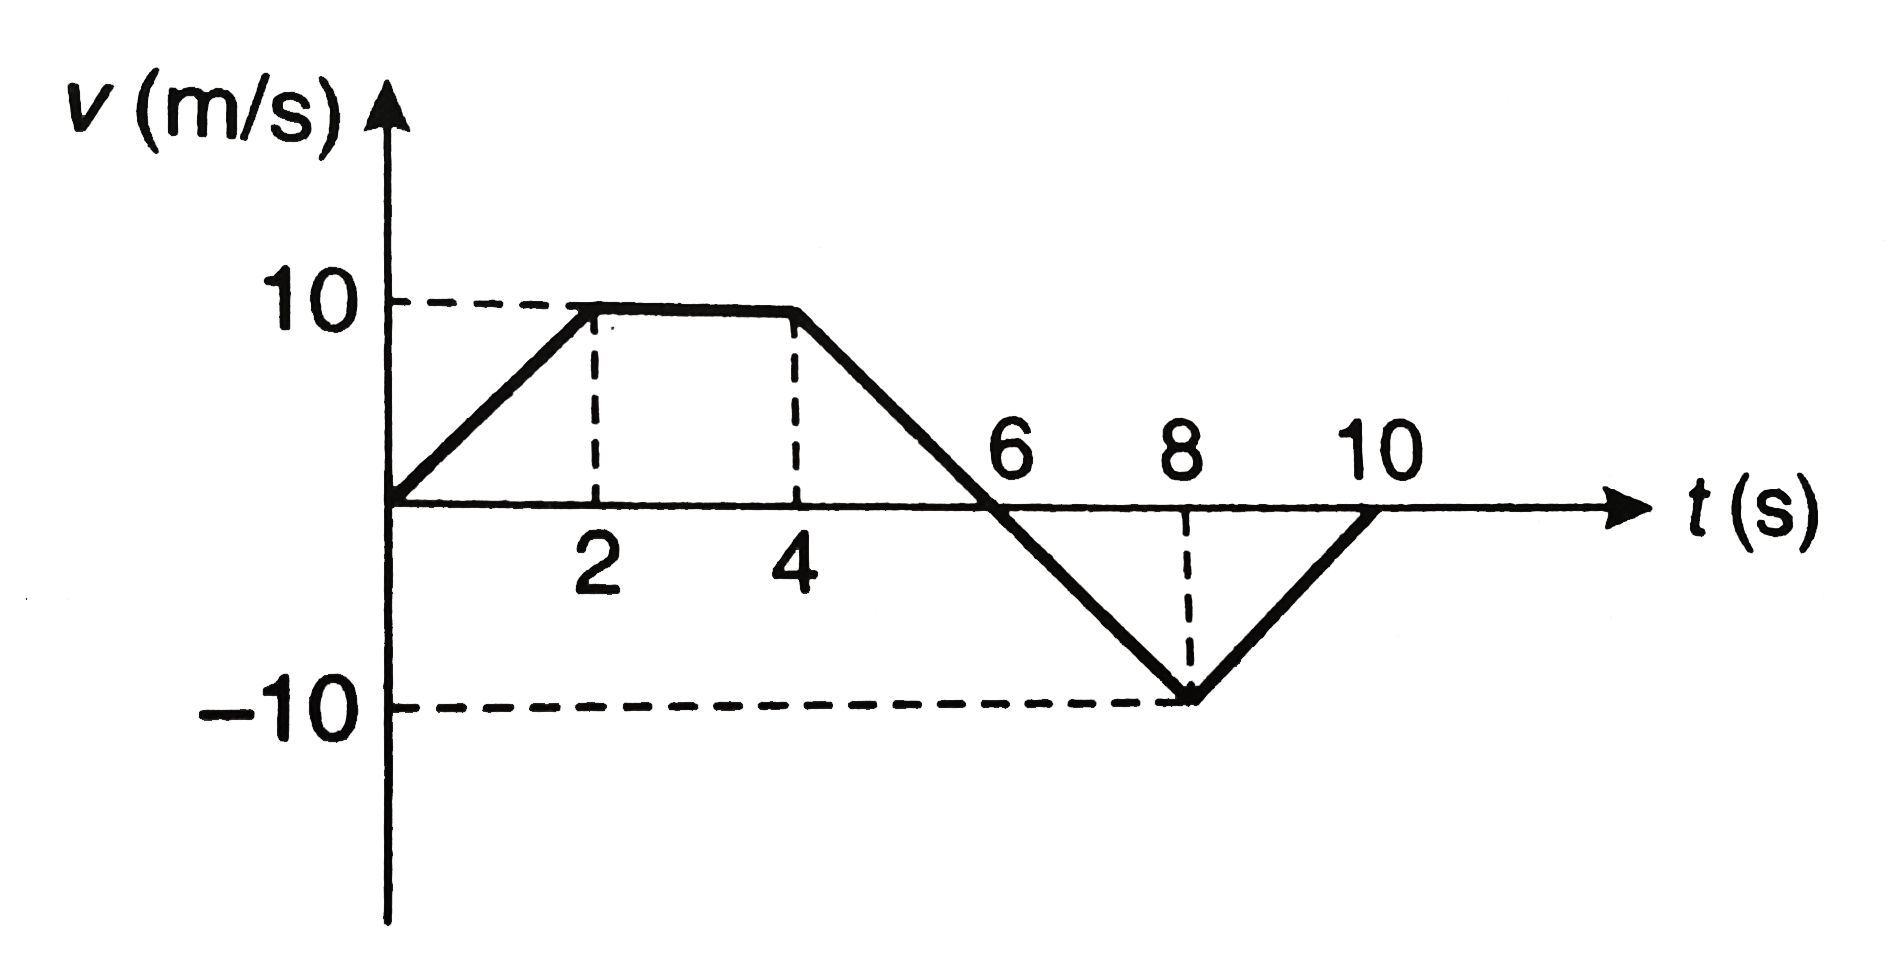
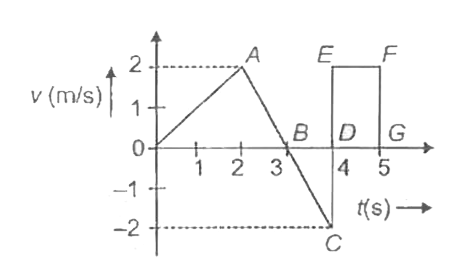
View SolutionThe velocity - time graph of a particle moving along a straight line is shown in the figure given below
The displacement of the particle in 5 second is
View Solution
The velocity displacement graph of a particle moving along a straight line is shown in figure.
Then the acceleration displacement graph is.
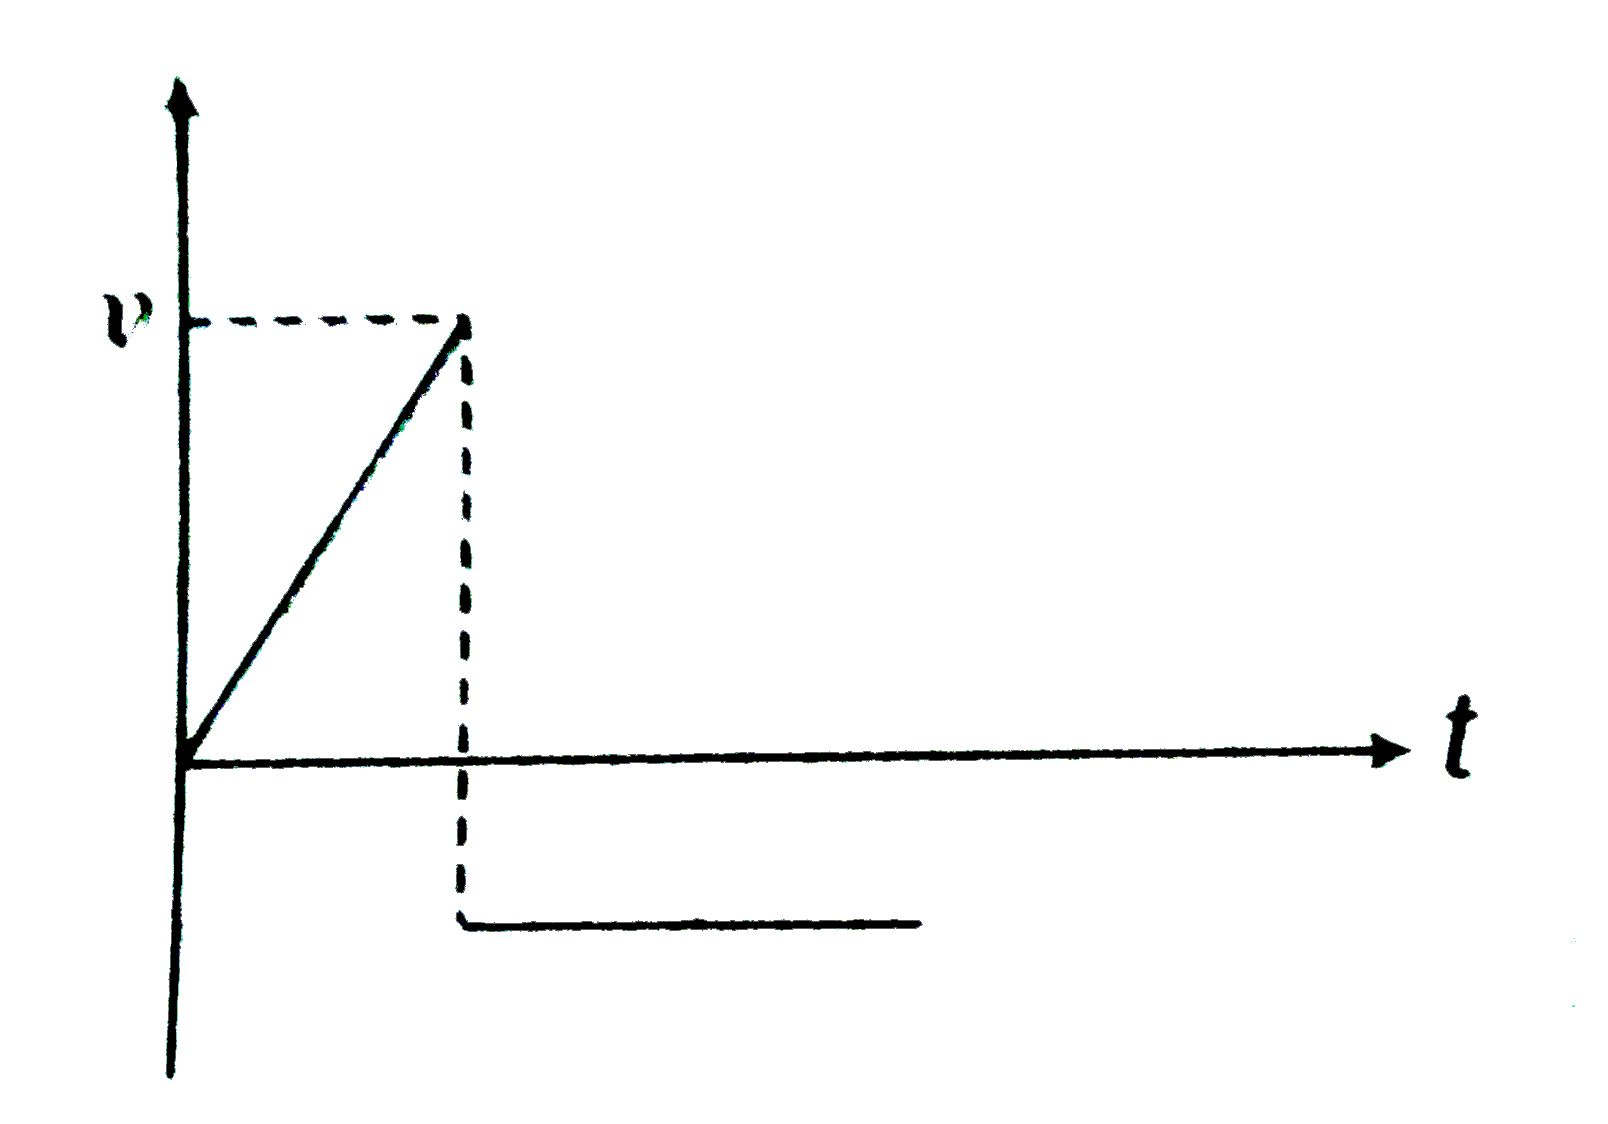
View SolutionThe velocity-time graph for a particle moving along X-axis is shown in the figure. The corresponding displacement-time graph is correctly shown by
View SolutionDisplacement time graph of a particle moving in a straight line is as shown in figure. Select the correct alternative (s) :
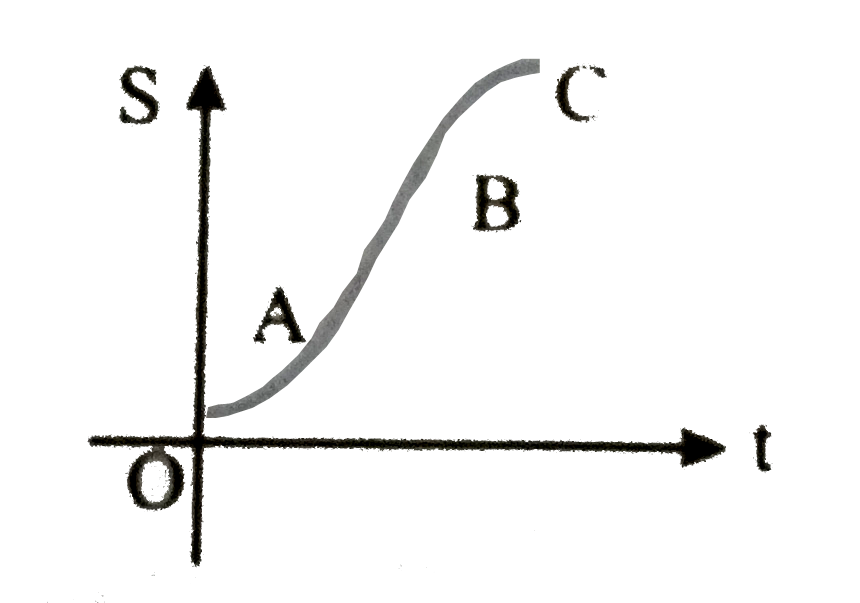 .
.
View SolutionDisplacment-time graph of a particle moving in a straight line is as shown in figure. Choose the INCORRECT statement(s)
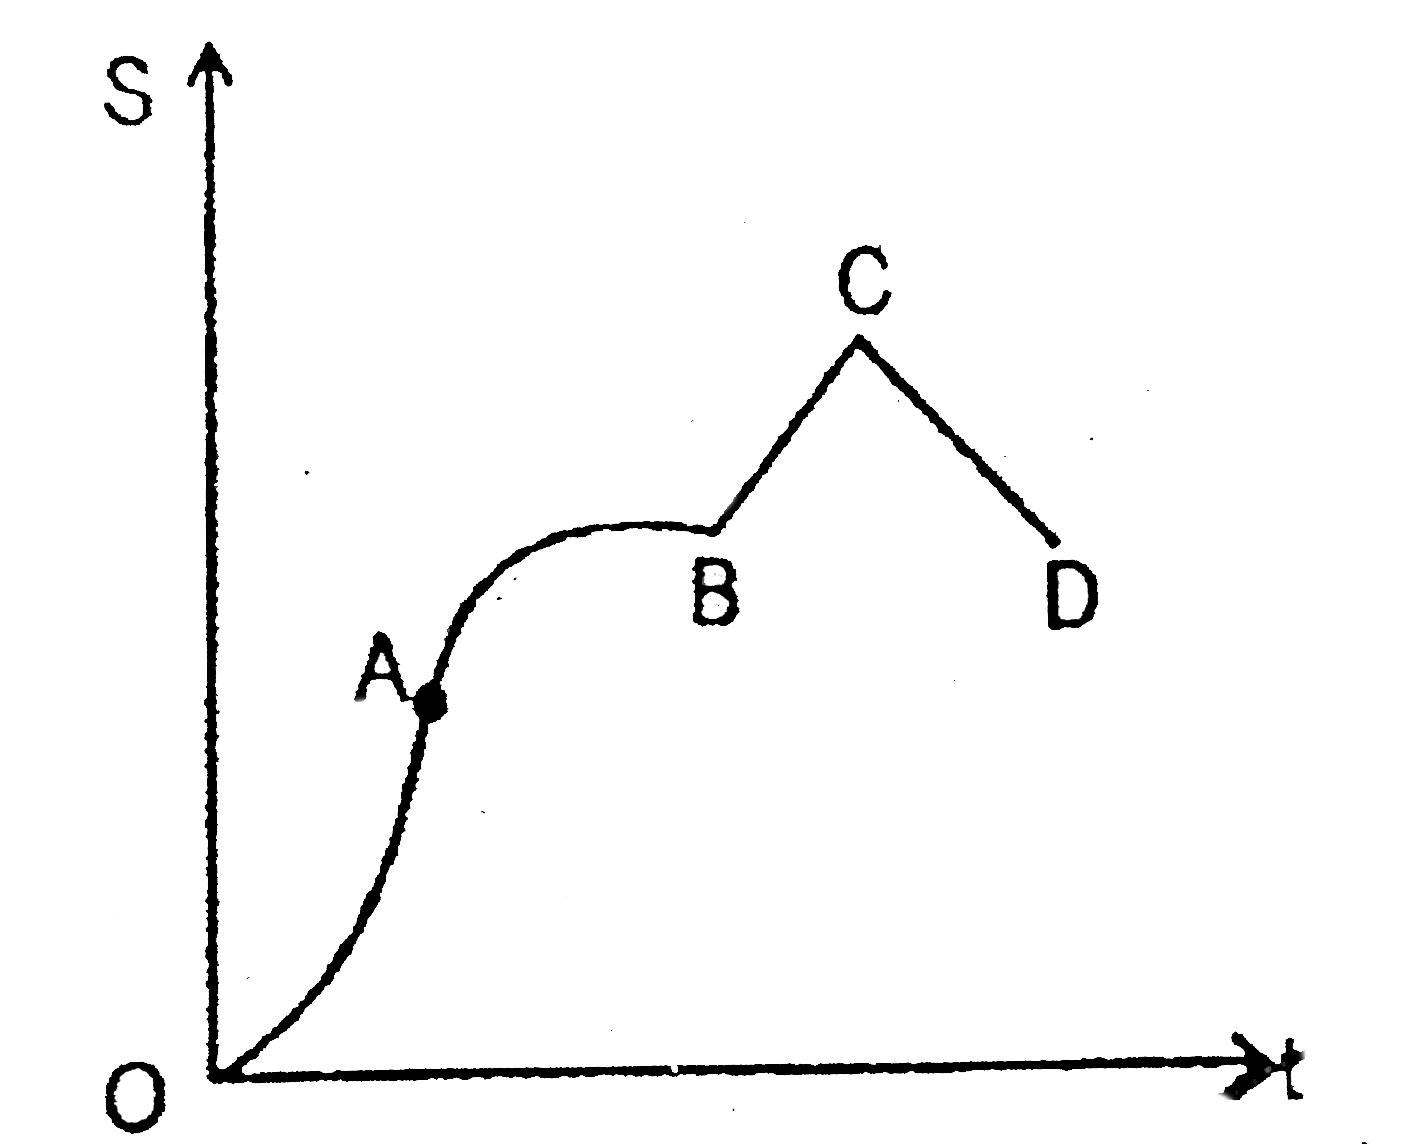
View Solution
