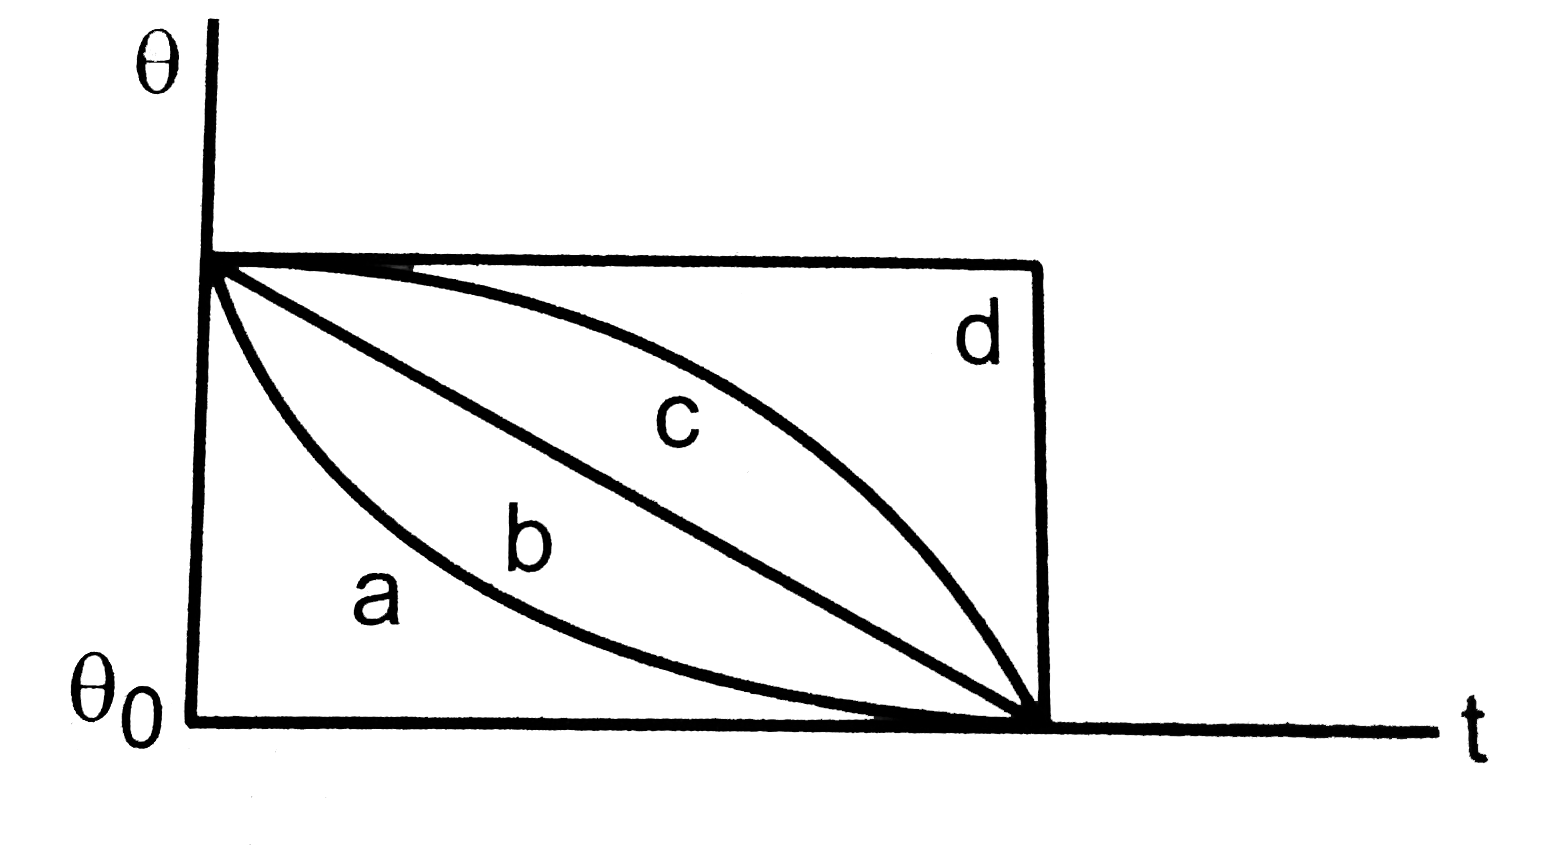
A piece of cork starts from rest at the bottom of a lake and floats up. Its velocity v is plotted against time t. Which of the following best represents the resulting curve?
_S01_061_Q01.png)
The correct Answer is:A
As the cork moves up, the force due to buoyancy remains constant. As its speed increases, the retardig force due to viscosity increases, being proportional to the speed. Thus the acceleration gradually decreases.
Topper's Solved these Questions
- BOOK - ALLENCHAPTER - ELASTICITY, SURFACE TENSION AND FLUID MECHANICSEXERCISE - Exercise 1 (Elasticity)16videos
ELASTICITY, SURFACE TENSION AND FLUID MECHANICS
- BOOK - ALLENCHAPTER - ELASTICITY, SURFACE TENSION AND FLUID MECHANICSEXERCISE - Exercise 1 (Surface Tension)21videos
ELASTICITY, SURFACE TENSION AND FLUID MECHANICS
- BOOK - ALLENCHAPTER - CENTRE OF MASSEXERCISE - EXERCISE-V B19videos
CENTRE OF MASS
- BOOK - ALLENCHAPTER - ERROR AND MEASUREMENTEXERCISE - Part-2(Exercise-2)(B)22videos
ERROR AND MEASUREMENT
Similar Questions
A ray of light travels from a medium of refractive index μ to air. Its angle of incidence in the medium is i, meansured from the normal to the boundary , and its angle of deviation is δ.δ is plotted against i. Which of the following best represents the resulting curve ?
View SolutionWhich of the following P-V curve best represents. As isothermal process?
View SolutionThe two ends of a uniform conductor are joined to a cell of e.m.f. E and some internal resistance. Starting from the midpoint P of the conductor, we move in the direction of current and return to P. The potential V at every point on the path is plotted against the distance covered (x). which of the following graphs best represent the resulting curve ?
View SolutionA hot liquid is kept in a big room. Its temperature is plotted as a function of time. Which of the following curves may represent the plot?
 View Solution
In an LR circuit connected to a battery, the rate at which energy is stored in the inductor is plotted against time during the growth of current in the circuit. Which of the following best represents the resulting curve?
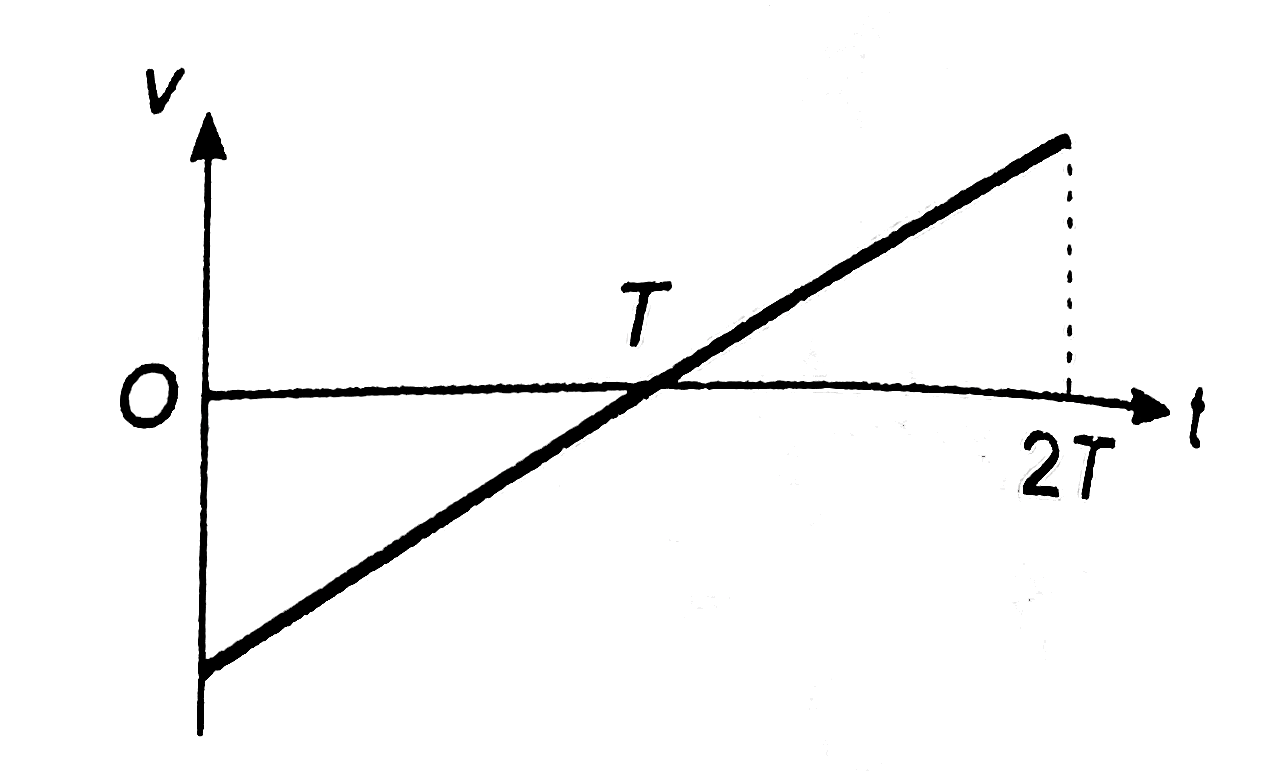
View SolutionThe figure shows the velocity (v) of a particle plotted against time (t).
 View Solution
The figure shows the velocity (v) of a particle plotted against time (t).
 View Solution
When an electric heater is switched on, the current flowing through it ( i ) is plotted against time ( t ). Taking into account the variation of resistance with temperature, which of the following best represents the resulting curve
View SolutionA solid sphere of radius R is charged uniformly. The electrostatic potential V is plotted as a function of distance r from the centre of th sphere. Which of the following best represents the resulting curve?
View SolutionA particle is projected at t=0 from a point on the ground with certain velocity at an angle with the horizontal. The power of gravitation force is plotted against time. Which of the following is the best representation?
View Solution
