एक कंपनी प्रथम तीन माह के दौरान प्रतिमाह औसतन 3500 खिलौने बनाती है। शेष 9 माह में प्रति माह औसतन कितने खिलौने बनाए कि पूरे वर्ष के दौरान प्रतिमाह औसत 4400 खिलाने का हो ?
4500
4570
4680
4700
The correct Answer is:D
Step by step video, text & image solution for एक कंपनी प्रथम तीन माह के दौरान प्रतिमाह औसतन 3500 खिलौने बनाती है। शेष 9 माह में प्रति माह औसतन कितने खिलौने बनाए कि पूरे वर्ष के दौरान प्रतिमाह औसत 4400 खिलाने का हो ? by Maths experts to help you in doubts & scoring excellent marks in Class 14 exams.
Topper's Solved these Questions
- BOOK - MAHESH MISHRACHAPTER - औसत EXERCISE - 17 B (प्रतियोगी परीक्षाओं में पूछे गए प्रश्न)24videos
औसत
- BOOK - MAHESH MISHRACHAPTER - एकघातीय और द्विघातीय समीकरण EXERCISE - 28 C (प्रतियोगी परीक्षाओं हेतु अभ्यास प्रश्नमाला)43videos
एकघातीय और द्विघातीय समीकरण
- BOOK - MAHESH MISHRACHAPTER - क्रमचय और संचयEXERCISE - 26 C (प्रतियोगी परीक्षाओं हेतु अभ्यास प्रश्नमाला)35videos
क्रमचय और संचय
Similar Questions
17 संख्याओं का औसत 45 है। उसमें से प्रथम संख्याओं का औसत.51 और अंतिम 9 संख्याओं का औसत 36 है । 9वीं संख्या क्या है ?
02:20View Solution13(4x+2)−12(6x–5)=2x+1 में x का मान है
01:40View Solution8 छात्र गणित विषय के, 7 छात्र विज्ञान के तथा 4 छात्र अंग्रेजी विषय के है। कितने तरीके से इन छात्रों को स्कॉलरशिप दिए जा सकते हैं यदि यह सर्वोच्च स्थान प्राप्त करनेवालों को ही दिया जाता है ?
01:39View SolutionA man spends Rs. 180 monthly on an average for the first four months and Rs. 200 monthly for the next eight months and saves Rs.560 a year. His average monthly income is - एक आदमी प्रथम चार माह में औसतन Rs.180 का मासिक खर्च करता है और अगले 8 माह में Rs.200 मासिक खर्च करता है और वर्ष में Rs.560 की बचत कर लेता है। उसकी औसतन मासिक आय कितनी है?
02:25View SolutionThe following line diagram represents the yearly sales figure of a company in the years 2001-2010. Examine the diagram and answer the question. निम्नलिखित रेखा आरेख किसी कंपनी की वर्ष 2007-2010 के दौरान वार्षिक बिक्री के आंकड़ों को दर्शाता है। आरेख का अध्ययन करें और नीचे दिए गए प्रश्नों के उत्तर दें- The ratio of sales in 2002 to that in 2007 is वर्ष 2002 में बिक्री का वर्ष 2007 में बिक्री के साथ अनुपात है-
02:18View SolutionThe following line diagram represents the yearly sales figure of a company in the years 2001-2010. Examine the diagram and answer the question. निम्नलिखित रेखा आरेख किसी कंपनी की वर्ष 2007-2010 के दौरान वार्षिक बिक्री के आंकड़ों को दर्शाता है। आरेख का अध्ययन करें और नीचे दिए गए प्रश्नों के उत्तर दें- Average sale (in crore of Rs.) of the company during the period 2003-2007 is वर्ष 2003 - 2007 की अवधि के दौरान कंपनी की औसत बिक्री (₹ करोड में) है-
02:37View Solutionसांस्कृतिक पर्वो के दौरान कक्षा में लोकगीतों की प्रस्तुति का आयोजन करने का उद्देश्य है।
03:41View Solutionमानव में अवायवीय श्वसन के दौरान किसका निर्माण होता है
05:46View SolutionAn art exhibition was held in the month of november. The numbers of visitors on weekdays and on weekends were 450 and 750 respectively. If the first day of the month was Monday, then what was the average number of visitors in the month ?
नवंबर माह में एक कला प्रदर्शनी आयोजित की गई | सप्ताह के कार्यदिवसों (वीकडेज) और सप्ताहांत (वीक-एंड) पर आने वाले आगंतुकों की औसत संख्या क्रमश: 450 और 750 थी | यदि माह का पहला दिन सोमवार था, तो माह में आगंतुकों की औसत संख्या कितनी थी?05:06View SolutionA sum of Rs. 20,000 is invested for 15 months at the interest of 10% per annum compounded half yearly. What is the percentage gain, correct to one decimal place, at the end of 15 months?
20,000 रुपये की एक राशि 15 माह के लिए 10% प्रति वर्ष अर्धवार्षिक चक्रवृद्धि पर निवेश की जाती है | 15 माह के अंत में एक दशमलव स्थान तक लाभ प्रतिशत ज्ञात करें |01:53View SolutionA sum of Rs 12,000 is invested for 15 months at 10% per annum compounded half yearly. What is the percentage gain, at
12000 रुपये की एक राशि 15 माह के लिए 10% प्रति वर्ष अर्धवार्षिक चक्रवृद्धि पर निवेश की जाती है| प्रतिशत लाभ ज्ञात करें |03:20View SolutionA sum of Rs 10,000 is invested for 17 months at 8% per annum compounded half yearly. What is the percentage gain at the end of 17 month, nearest to one decimal place?
10,000 रुपये की एक राशि को 17 माह के लिए 8% प्रति वर्ष अर्धवार्षिक चक्रवृद्धि पर निवेश किया जाता है | 17 माह के अंत में लाभ प्रतिशत ज्ञात करें |01:37View SolutionThe table shows the production of different types of cars (in thousands). यह तालिका एक कंपनी द्वारा अलग-अलग कारों के उत्पादन (हज़ार में ) को दर्शाती है | The average production of type A cars during the five years is what percent of the total production of type C cars during the five years? पांच वर्षों के दौरान A प्रकार की कारों का औसत उत्पादन पांच वर्षों के दौरान C प्रकार की कारों के कुल उत्पादन का कितना प्रतिशत है ?
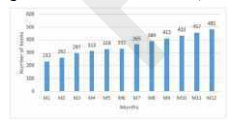
02:19View SolutionThe bar graph given below presents the number of books sold by a bookseller during different months of a year.
नीचे दिया गया दंड आरेख एक पुस्तक विक्रेता के द्वारा किसी वर्ष के अलग-अलग महीनों में बेची गयी पुस्तकों की संख्या को दर्शाता है |
The number of books sold in month M8 is how much more than the average number of books sold per month?
माह M8 में बेची गयी पुस्तकों की संख्या प्रति माह बेची गयी पुस्तकों की औसत संख्या से कितना प्रतिशत अधिक है ?01:33View SolutionThe bar graph given below shows the profit (in multiples of thousand rupees) of a company during the year 2010-2018. The average profit for the year 2015-2017 is what percentage more than the 2012 profit? नीचे दिए गए दंड आरेख में वर्ष 2010-2018 के दौरान किसी कंपनी के लाभ (हजार रुपए के गुणक में) को दर्शाया गया है | वर्ष 2015-2017 का औसत लाभ 2012 के लाभ से कितना प्रतिशत अधिक है ?
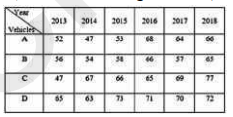
01:42View SolutionThe table given below presents the figures of the production (in thousands) of different types of vehicles by a company during the year 2013-18.
नीचे दी गयी तालिका वर्ष 2013-18 के दौरान एक कंपनी के द्वारा विभिन्न प्रकार के वाहनों के उत्पादन ( हज़ार में)के आंकड़ों को प्रस्तुत करती है | In how many years is the production of type C vehicles, below the average production of type D vehicles over six years?
कितने वर्ष C प्रकार के वाहनों का उत्पादन इन छः वर्षों में D प्रकार के वाहनों के औसत उत्पादन से कम रहा है ?02:07View Solution
