दिया गया दंड-चार्ट तीन वर्षो में एक विद्यार्थी द्वारा प्रत्येक विषय में प्राप्त किये गए अंको को दर्शाता है
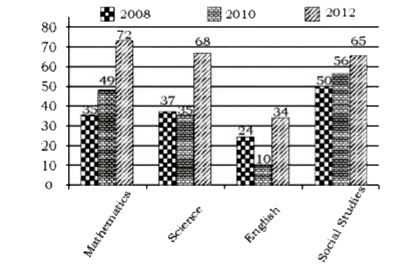
दिए गए दंड-चार्ट में, वर्ष 2010 में किस विषय में सबसे कम अंक प्राप्त हुए ?
सामाजिक विज्ञानं
अंग्रेजी
विज्ञानं
गणित
The correct Answer is:B
Step by step video, text & image solution for दिया गया दंड-चार्ट तीन वर्षो में एक विद्यार्थी द्वारा प्रत्येक विषय में प्राप्त किये गए अंको को दर्शाता है दिए गए दंड-चार्ट में, वर्ष 2010 में किस विषय में सबसे कम अंक प्राप्त हुए ? by Maths experts to help you in doubts & scoring excellent marks in Class 14 exams.
Updated on:21/07/2023Topper's Solved these Questions
Similar Questions
यदि A:B=2:3 और B:C=3:7, तो A+B:B+C:C+A क्या होगा?
View SolutionP और Q की वर्तमान आयु के बीच का क्रमशः अनुपात 3 : 4 है। चार वर्ष बाद Q, P से पाँच वर्ष बड़ा होगा।P की वर्तमान आयु कितनी है?
View SolutionMatch the following Column A to Column B

View SolutionThe given pie-chart shows the break-up of total marks obtained by a student in five subject A, B,C, D and E. The maximm marks in each subject is 150 and he obtained a total of 600 marks. निम्नलिखित वृत्त आरेख (पाई चार्ट) में एक विद्यार्थी द्वारा पांच विषयों (A, B,C, D और E) में प्राप्त कुल अंकों का विभाजन (ब्रेकअप) दर्शाया गया है। प्रत्येक विषय में अधिकतम अंक 150 हैं और उसने कुल 600 अंक प्राप्त किए हैं। The total marks obtained by the student in subject C and E is approximately how much percent more than what he obtained in A and D together? C और E विषयों में विद्यार्थी के द्वारा प्राप्त कुल अंक, उसके द्वारा A और D में प्राप्त कुल अंको से कितने प्रतिशत अधिक है?
View SolutionA scored 72% in a paper with a maximum marks of 900 and 80% in another paper with a maximum marks of 700. If the result is based on the combined percentage of two papers, the combined percentage is 900 अधिकतम अंकों में से A ने एक विषय में 72% अंक प्राप्त किए और दूसरे विषय में अधिकतम 700 अंको में से 80% अंक प्राप्त किए। यदि परिणाम दोनों विषयों की सम्मिलित प्रतिशतता पर आधारित हो तो बताइए सम्मिलित प्रतिशतता क्या है?
View Solutionअमित दुखी था क्योंकि उसे किस विषय में अच्छे अंक प्राप्त नहीं हुए थे।
View SolutionThe given pie chart shows runs scored by A in 6 matches.
दिया गया पाई चार्ट A के द्वारा 6 मैचों में बनाए गए रनों को दर्शाता है |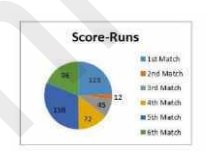 In the given pie-chart, what is the increase or decrease in score in match 4 as compared to match 2?
/ इस पाई चार्ट में मैच 2 की तुलना में मैच 4 के स्कोर में कितनी वृद्धि या कमी हुई है ?
View SolutionThe given bar graph shows the number of marks scored by a student in each subject in three years.
दिया गया दंड आरेख एक छात्र के द्वारा तीन वर्षो में प्रत्येक विषय में लाये गए अंकों को दर्शाता है |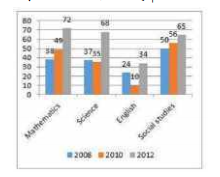 In the given chart, what is the percentage increase in marks in Mathematics in 2012 compared to 2008 (round off) ? /
इस आरेख में वर्ष 2008 की तुलना में वर्ष 2012 में गणित के अंकों में कितने प्रतिशत की वृद्धि हुई है ?
View SolutionThe given bar graph shows the number of marks scored by a student in each subject in three years.
दिया गया दंड आरेख एक छात्र के द्वारा तीन वर्षो में प्रत्येक विषय में लाये गए अंकों को दर्शाता है |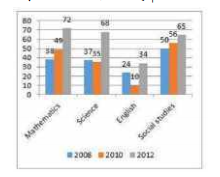 In the given chart, in which subject was the lowest marks scored in 2010?
इस दंड आरेख के अनुसार वर्ष 2010 में किस विषय में सबसे कम अंक आये थे?
View SolutionThe given bar graph shows the number of marks scored by a student in each subject in three years.
दिया गया दंड आरेख एक छात्र के द्वारा तीन वर्षो में प्रत्येक विषय में लाये गए अंकों को दर्शाता है |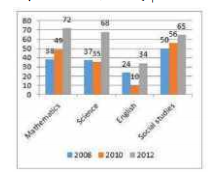 In the given chart, the number of marks in social studies in 2012 is 13% of the school strength. The number of students is:
दिए गए चार्ट में, यदि वर्ष 2012 में सामाजिक अध्ययन में अंकों की संख्या स्कूल की के छात्रों की संख्या का 13% है। छात्रों की संख्या कितनी है?
View SolutionThe given pie-chart shows the break-up of total marks obtained by a student in five subjects A, B, C, D and E. The maximum marks in each subject is 150 and he obtained a total of 600 marks.
दिया गया पाई-चार्ट एक छात्र के द्वारा पांच विषयों A, B, C, D और E में प्राप्त किये गए कुल अंकों को विच्छेदित करके दर्शाता है | प्रत्येक विषय का अधिकतम अंक 150 है और उसे कुल 600 अंक मिले हैं |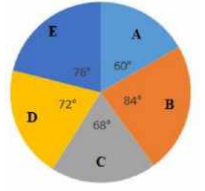 The total marks obtained by the student in subjects C and E is approximately how much percent more than what he obtained in A and D together?
इस छात्र द्वारा विषय C और E में प्राप्त किये गए अंक उसके द्वारा A और D में एक साथ प्राप्त किये गए अंक से लगभग कितने प्रतिशत अधिक हैं ?
View SolutionThe given pie-chart shows the break-up of total marks obtained by a student in five subjects A, B, C, D and E. The maximum marks in each subject is 150 and he obtained a total of 600 marks.
दिया गया पाई-चार्ट एक छात्र के द्वारा पांच विषयों A, B, C, D और E में प्राप्त किये गए कुल अंकों को विच्छेदित करके दर्शाता है | प्रत्येक विषय का अधिकतम अंक 150 है और उसे कुल 600 अंक मिले हैं | What is the difference between the marks obtained by the student in subjects B and D?
इस छात्र द्वारा विषय B और D में प्राप्त किये गए अंकों में अंतर ज्ञात करें|
View SolutionThe given Bar Graph presents the number of students of two schools for six years. दिया गया दंड आरेख छः वर्ष की अवधि में दो विद्यालयों में छात्रों की संख्या को दर्शाता है | In which year, the percentage increase in students in school B is the highest in comparison to its previous year? किस वर्ष में, विद्यालय B में छात्रों की संख्या में प्रतिशत वृद्धि इसके पिछले वर्ष की तुलना में सबसे अधिक रही है?
View SolutionThe given Bar Graph presents the number of students of two schools for six years. दिया गया दंड आरेख छः वर्ष की अवधि में दो विद्यालयों में छात्रों की संख्या को दर्शाता है | In which year, the absolute difference of the students in two schools is the lowest? किस वर्ष में, दोनों विद्यालयों के छात्रों में पूर्ण अंतर सबसे कम है ?
View SolutionThe given pie chart shows the expenditure given in millions on each game. दिया गया पाई चार्ट प्रत्येक खेल पर करोड़ो में दिए गए व्यय को दर्शाता है | In the given pie chart, what is the difference between expenditure on cricket and football ? दिए गए पाई चार्ट में , क्रिकेट और फुटबॉल पर किये गए व्यय के बीच क्या अंतर है ?
View SolutionThe Table given below presents the marks obtained by three students in five examinations. नीचे दी गयी तालिका पांच परीक्षाओं के तीन विषयों में छात्रों के द्वारा प्राप्त किये गए अंकों को दर्शाती है | The marks obtained by S1 in Exam E5 is how much percentage (correct up to two places of decimal) more than that obtained by S2 in Exam E3? S1 के द्वारा परीक्षा E5 में प्राप्त किये गए अंक S2 के द्वारा परीक्षा E3 में प्राप्त किये गए अंक से कितने प्रतिशत अधिक ( दो दशमलव स्थान तक) हैं ?
View Solution
