The total target production of AC machines in February, April and May was what percentage less than the total actual production of Ac Machines over all the five months.
0.462
0.468
0.471
0.476
The correct Answer is:D
To solve the question, we need to find the percentage by which the total target production of AC machines in February, April, and May is less than the total actual production over all five months.
1. Identify the Target Production for February, April, and May:
- From the video transcript, we have:
- February's target = 30
- April's target = 90
- May's target = 100
- Total Target Production = February's target + April's target + May's target
- Total Target Production = 30 + 90 + 100 = 220.
2. Identify the Actual Production for All Five Months:
- From the video transcript, the actual production for each month is:
- Month 1 = 70
- Month 2 = 50
- Month 3 = 100
- Month 4 = 80
- Month 5 = 120
- Total Actual Production = Month 1 + Month 2 + Month 3 + Month 4 + Month 5
- Total Actual Production = 70 + 50 + 100 + 80 + 120 = 420.
3. Calculate the Difference Between Actual Production and Target Production:
- Difference = Total Actual Production - Total Target Production
- Difference = 420 - 220 = 200.
4. Calculate the Percentage Less:
- To find the percentage less, we use the formula:
Percentage Less=(DifferenceTotal Actual Production)×100
- Substituting the values:
Percentage Less=(200420)×100
- Simplifying this:
Percentage Less=(200420)×100=(1021)×100≈47.62%
5. Conclusion:
- The total target production of AC machines in February, April, and May was approximately 47.62% less than the total actual production over all five months.
- From the video transcript, we have:
- February's target = 30
- April's target = 90
- May's target = 100
- Total Target Production = February's target + April's target + May's target
- Total Target Production = 30 + 90 + 100 = 220.
- From the video transcript, the actual production for each month is:
- Month 1 = 70
- Month 2 = 50
- Month 3 = 100
- Month 4 = 80
- Month 5 = 120
- Total Actual Production = Month 1 + Month 2 + Month 3 + Month 4 + Month 5
- Total Actual Production = 70 + 50 + 100 + 80 + 120 = 420.
- Difference = Total Actual Production - Total Target Production
- Difference = 420 - 220 = 200.
- To find the percentage less, we use the formula:
Percentage Less=(DifferenceTotal Actual Production)×100
- Substituting the values:
Percentage Less=(200420)×100
- Simplifying this:
Percentage Less=(200420)×100=(1021)×100≈47.62%
- The total target production of AC machines in February, April, and May was approximately 47.62% less than the total actual production over all five months.
Topper's Solved these Questions
Similar Questions
The given Bar Graph presents the Target and Actual production of AC Machines (numbers in thousands) of a factory over five months.
दिया गया दंड आरेख पांच महीनों के दौरान एक फैक्ट्री में एसी मशीनों के उत्पादन का लक्ष्य तथा वास्तविक उत्पाद को दर्शाता है |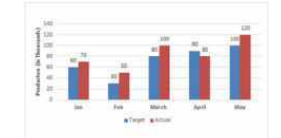 The ratio of the combined target production of AC Machines in January and April to that of the combined actual production of AC Machines in March and April was:
जनवरी और अप्रेल में एसी मशीनों के उत्पादन के संयुक्त लक्ष्य तथा मार्च और अप्रैल में एसी मशीनों के वास्तविक संयुक्त उत्पादन में क्या अनुपात है ?
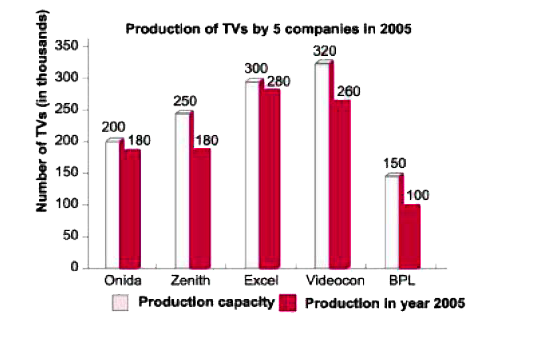
View SolutionThe TVs produced by Excel form what percentage of the total production?
View Solution
Knowledge Check
The actual production of Ac machines in April was that percentage more than the average target production of AC machines over five months?
A1019%B1119%C0.09D0.1The table shows the production of different types of cars (in thousands).
 T
T
The total production of all type of cars, except B in 2012 is what percent less than the total production of all types of cars in 2016A40B25.8C26.7D42The total production of type B cars in 2015 and type D cars 2016 is what percent less than the total production of type E cars in five years?
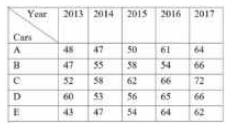 A5013B5449C4623D5313
Study the graph and answer the question
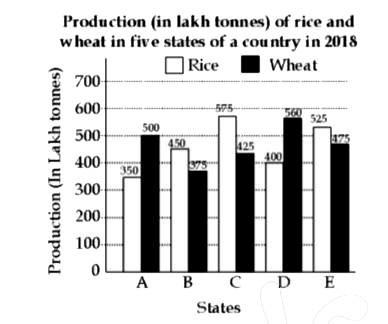
Total production of wheat in states A , B and E is what percentage less than the total production of rice in states C, D and E?
View SolutionThe given bar graph presents the target and actual production of AC machines of a factory over five months
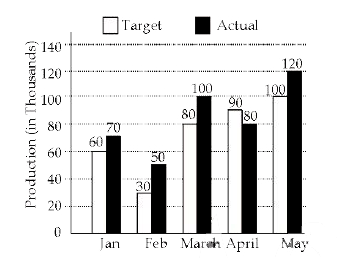
The ratio of the combined target production of AC machines in January and April to that of the combined actual production of AC Machines in March and April was
View SolutionThe table shows the production of different types of cars by a company (in thousands) in 5 years. Study the table and answer the questions.
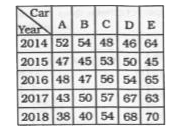
The total production of type B cars in all the five years is what per cent more than the total production of types A, B and D cars in 2017 ?
View SolutionThe table shows the production of different types of cars (in thousands)
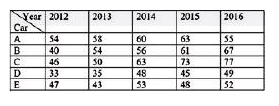
The total production of all types of cars , except type B, in 2012 is what percent less than the total production of all types of cars in 2016?
View SolutionThe table shows the production (in thousands) of different types of cars.
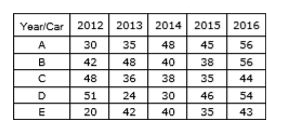
The total production of B type cars in the year 2012, 2014, and 2015 has been approximately what percentage more than the total production of A type cars in the year 2013 and 2016?
View Solution
