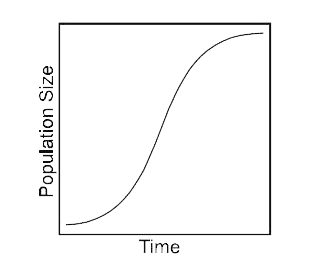
Many population colonising a new habitat show a logistic population growth pattern over time, as shown in the figure below.

In such a population, the POPULATION growth rate
A
stays constant over time
B
increases and then reaches an asymptote
C
decreases over time
D
increases to a maximum and then decrease
Video Solution
Text Solution
The correct Answer is:B
, As N approah decrease that is aymptote
|
Topper's Solved these Questions
- QUESTION PAPER 2013BOOK - KVPY PREVIOUS YEARCHAPTER - QUESTION PAPER 2013EXERCISE - PART-I ( BIOLOGY)
20 Videos
- MOCK TEST 9BOOK - KVPY PREVIOUS YEARCHAPTER - MOCK TEST 9EXERCISE - EXERCISE
18 Videos
- QUESTION PAPER 2020BOOK - KVPY PREVIOUS YEARCHAPTER - QUESTION PAPER 2020EXERCISE - PART-II(BIOLOGY)
10 Videos
Similar Questions
Knowledge Check
Human population growth is:
AlagBstationaryCexponentialDnone of thesePopulation growth rate depends upon
ABirth rateBDeath rateCAge - sex ratioDAll of theseThe magnitude of population growth refers to
Athe total population of areaBthe number of persons added each yearCthe rate at which the population increasesDthe number of females per thousand males
The magnitude of population growth refers to
View SolutionThe population growth rate in India is :
View SolutionRate of human population growth is
View SolutionThe logistic population growth is expressed by the equation
View SolutionThe logistic population growth is expressed by the equation :
View Solution
