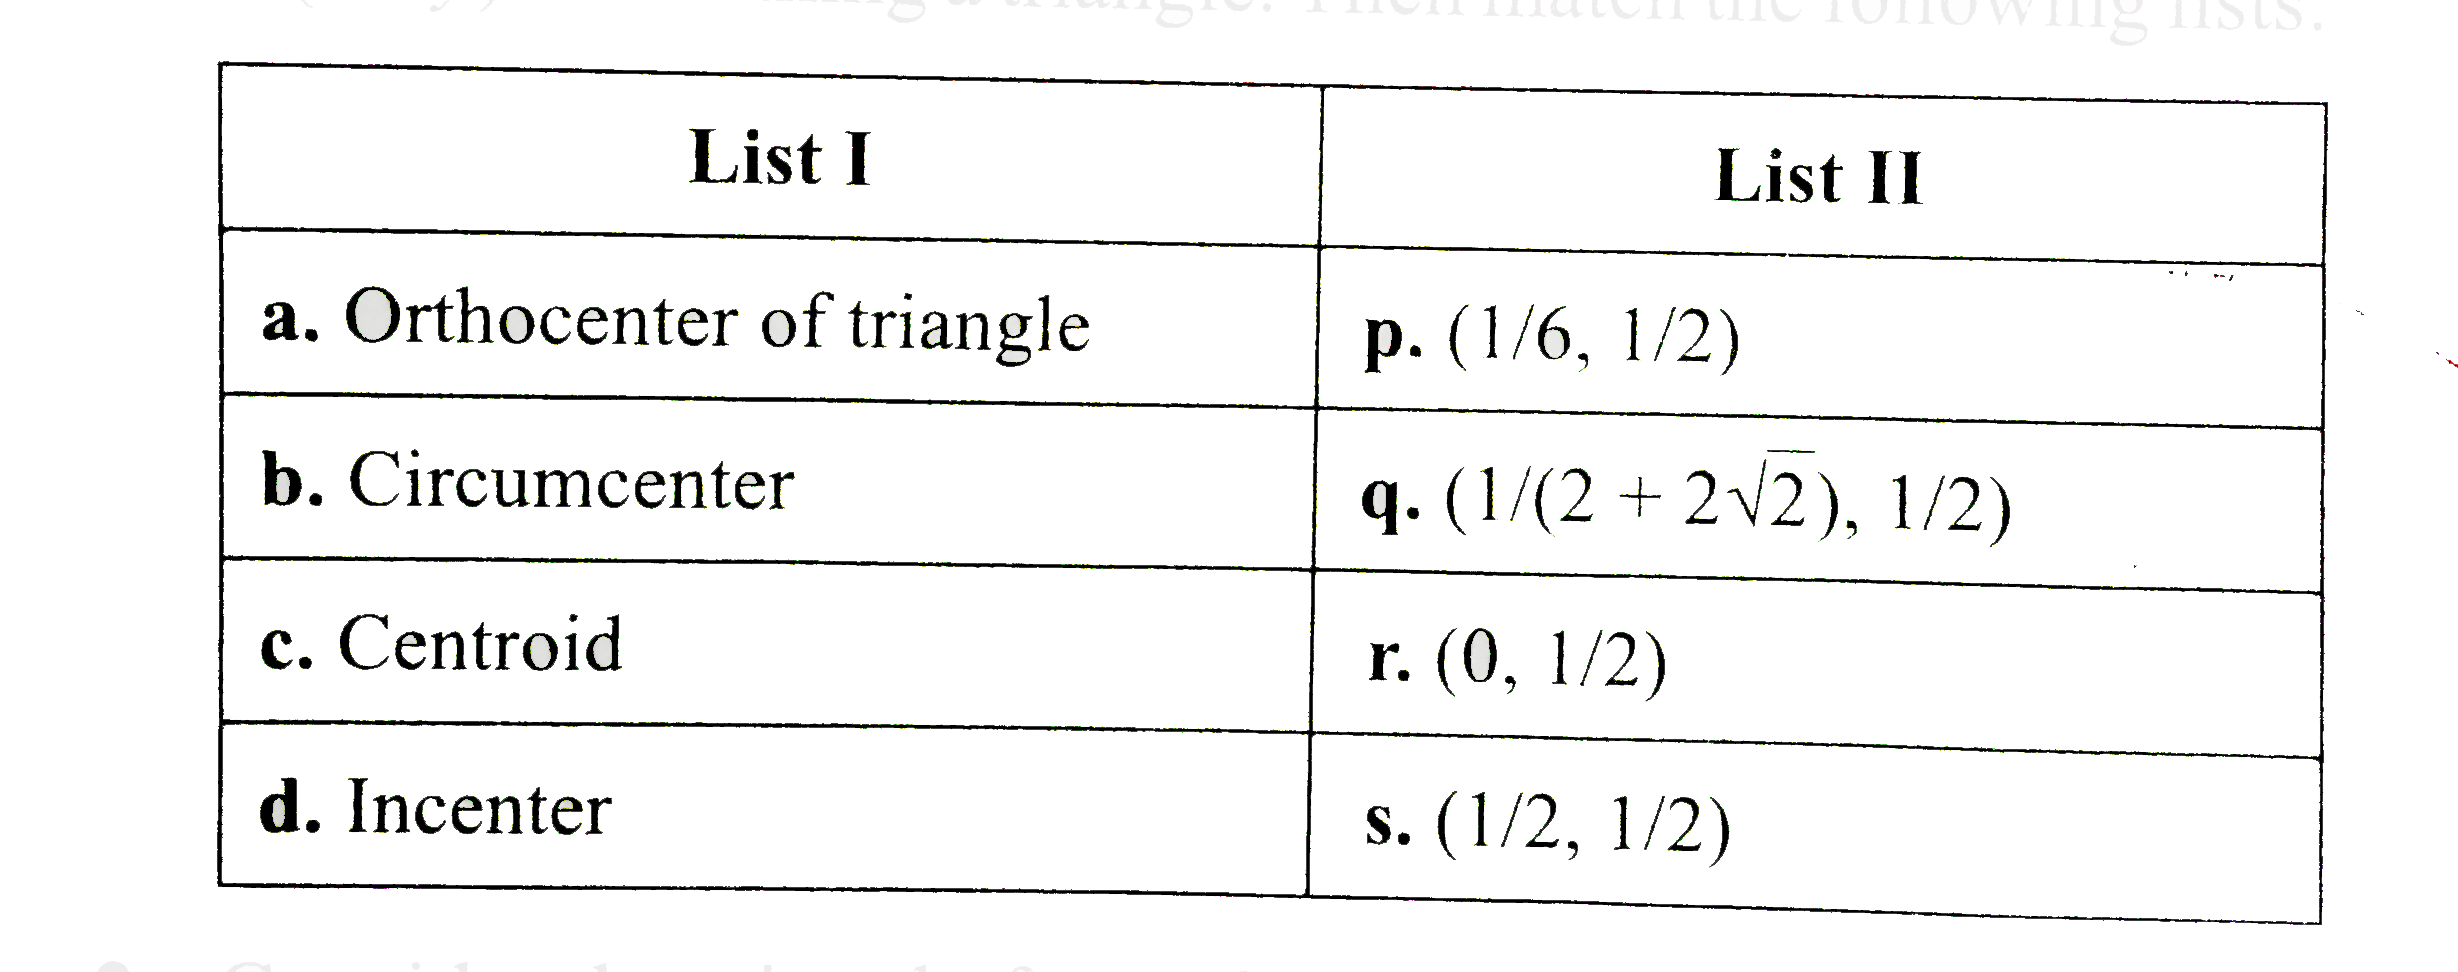
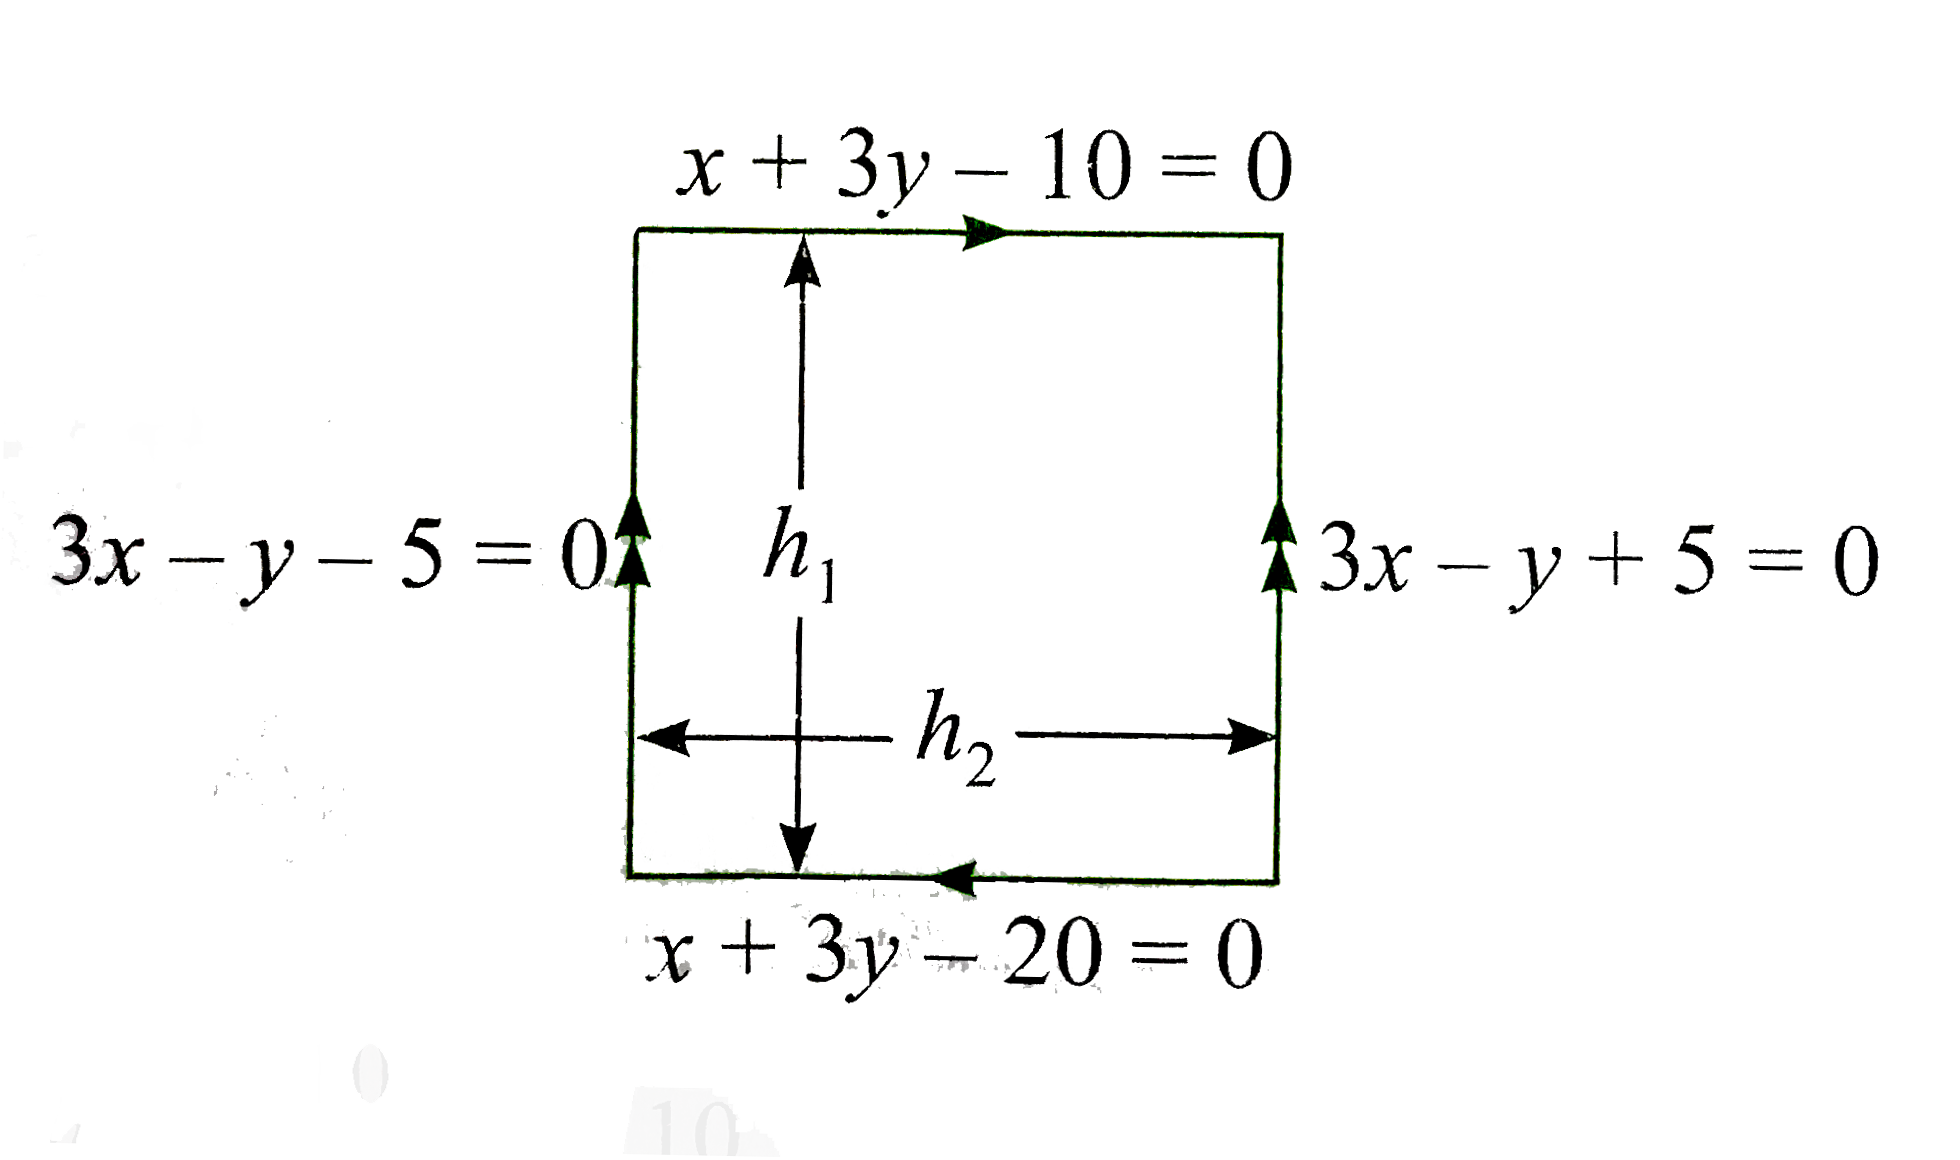
Consider the lines represented by equation forming a triangle. Then match the following lists:
 Solution in Bengali
The correct Answer is:
a.

Hence, the given lines form a square of side . Therefore, the area is 10 sq. units.

Topper's Solved these Questions
- STRAIGHT LINESBOOK - CENGAGE PUBLICATIONCHAPTER - STRAIGHT LINESEXERCISE - EXERCISE (NUMERICAL VALUE TYPE)
13 Videos
- STRAIGHT LINESBOOK - CENGAGE PUBLICATIONCHAPTER - STRAIGHT LINESEXERCISE - ARCHIVES (JEE MAIN)
9 Videos
- STRAIGHT LINESBOOK - CENGAGE PUBLICATIONCHAPTER - STRAIGHT LINESEXERCISE - EXERCISE (LINKED COMPREHENSION TYPE)
27 Videos
- STRAIGHT LINEBOOK - CENGAGE PUBLICATIONCHAPTER - STRAIGHT LINEEXERCISE - Multiple Correct Answers Type
8 Videos
- THEORY OF EQUATIONSBOOK - CENGAGE PUBLICATIONCHAPTER - THEORY OF EQUATIONSEXERCISE - JEE ADVANCED (Numerical Value Type )
1 Videos
Similar Questions
Find the number of permutations of the set {1,2,3,4} in which no two adjacent positions are filled by consecutive integers ( increasing orders).
View SolutionThe line L given by x5+yb=1 passes through the point (13,32).the line K is parallel to L and has the equation xc+y3=1 then the distance between L and K is
View SolutionLet l be the line belonging to the family of straight lines (a+2b)x+(a−3b)y+a−8b=0,a,b∈R, which is farthest from the point (2,2), then area enclosed by the line L and the coordinate axes is
View SolutionThe point P(α,α+1) will lie inside the triangle whose vertices are A(0,3),B(−2,0) and C(6,1) if
View SolutionThe number of distinct real roots of x4−4x3+12x2+x−1=0is_____.
View SolutionMatch the following lists:

View SolutionHow many lines of symmetry does the above figure have ?
View SolutionDetermine the point of symmetry of a regular hexagon.
View SolutionDtermine the images of the following figure about the given line :
View SolutionMatch the following Column A to Column B

View SolutionMatch the following Column A to Column B

View SolutionMatch the following Column A to Column B

View SolutionThe inequation represented by the graph given below is :
View SolutionThe inequation that best describes the graph given below is _________
View SolutionThe inequation that best describes the following graph is _________
View SolutionWhich inequations represent the shaded region in the given figure
View Solution
