Draw the graph of y=x−1x2 and hence the graph of y=|x−1|x2.Solution in Bengali
The domain of function is R - {0}.
1. y-intercept
Graph never intersects the y-axis as the domain does not contain x = 0.
2. x-intercept (zeros)
Put y = 0 or x - 1 =0
Hence the graph intersects the x-axis at (1, 0).
3. Asymptotes
Vertical asymptotes
Graph has vertical asymptote x = 0.
Horizontal asymptotes
Since the degree of the denominator is higher than the degree of the denominator , the graph has horizontal asymptote y = 0.
Clearly , the graph has no oblique asymptote.
4. Extremum
f'(x)=2x−x2x4=2−xx3
f'(x)=0⇒x=2
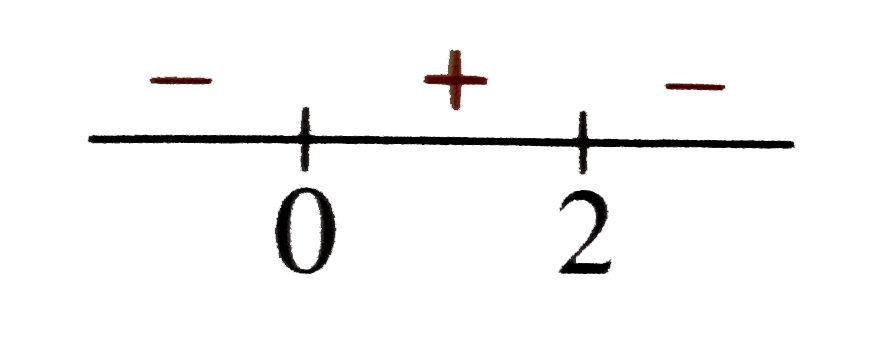
Sign scheme of f'(x) is as follows.

From the sign scheme, x = 2 is the point of maxima.
Also f(2)=14
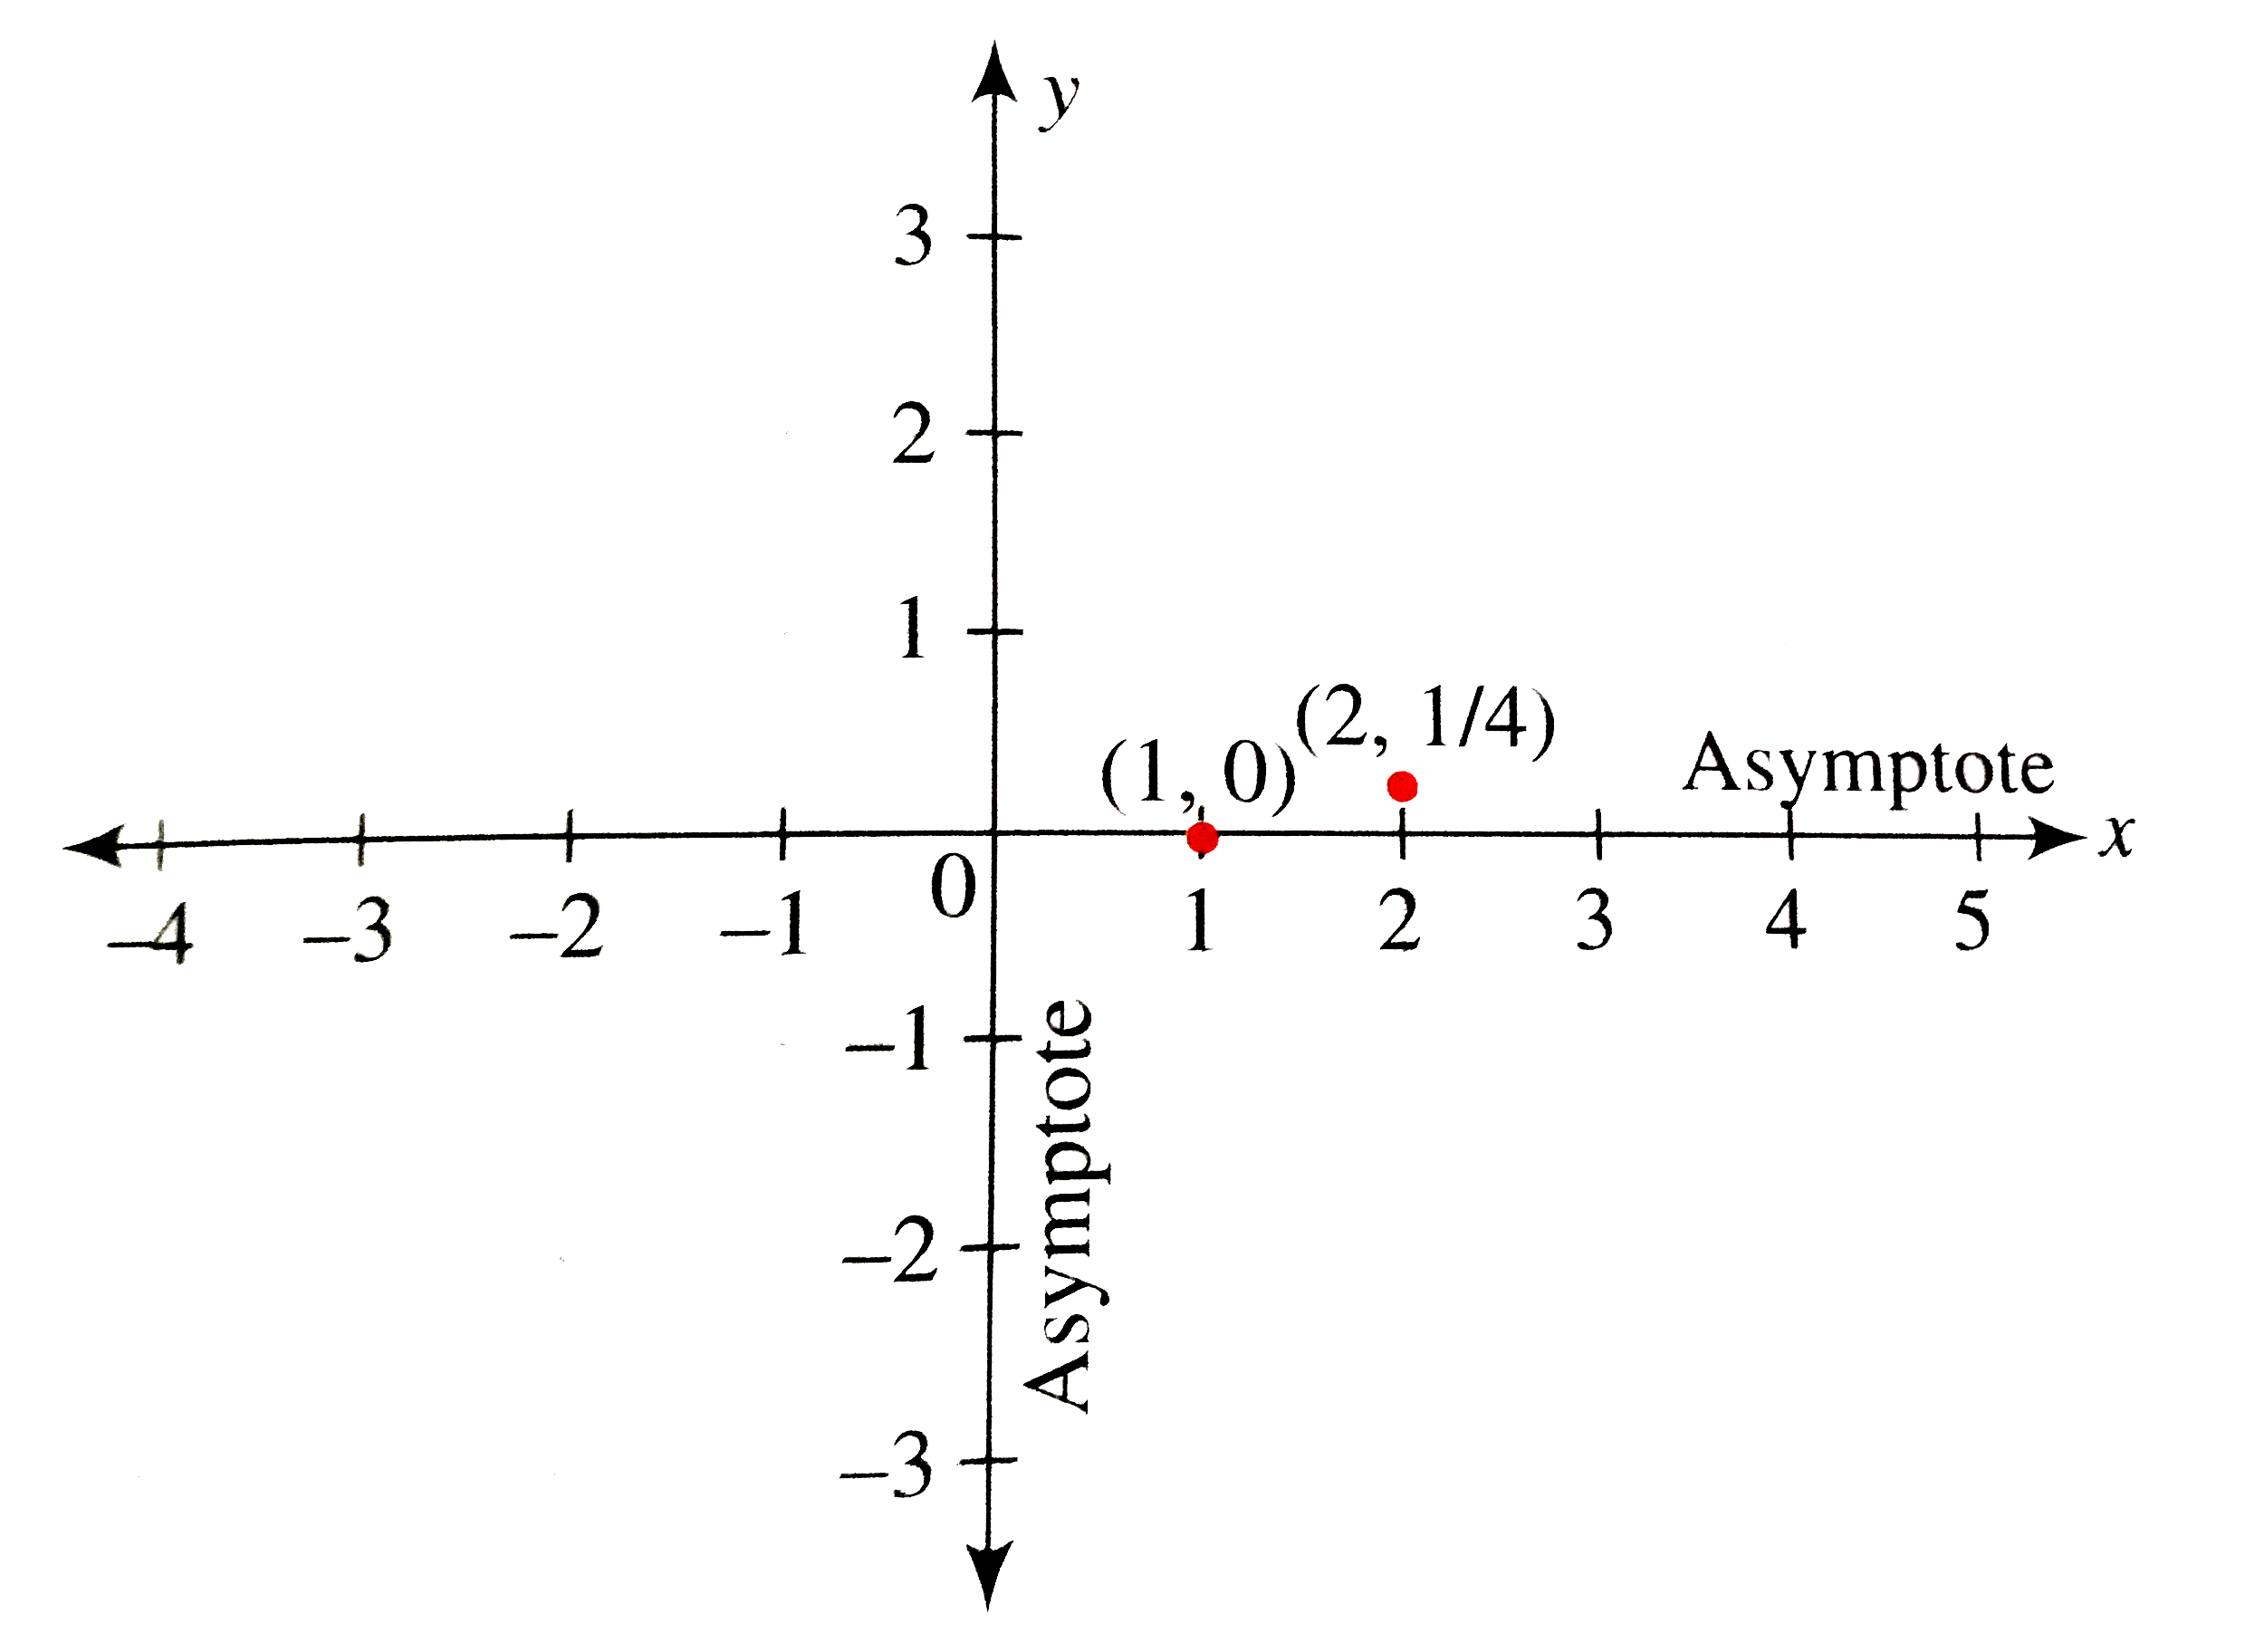
From the above discussion, we have the following reference points and lines.

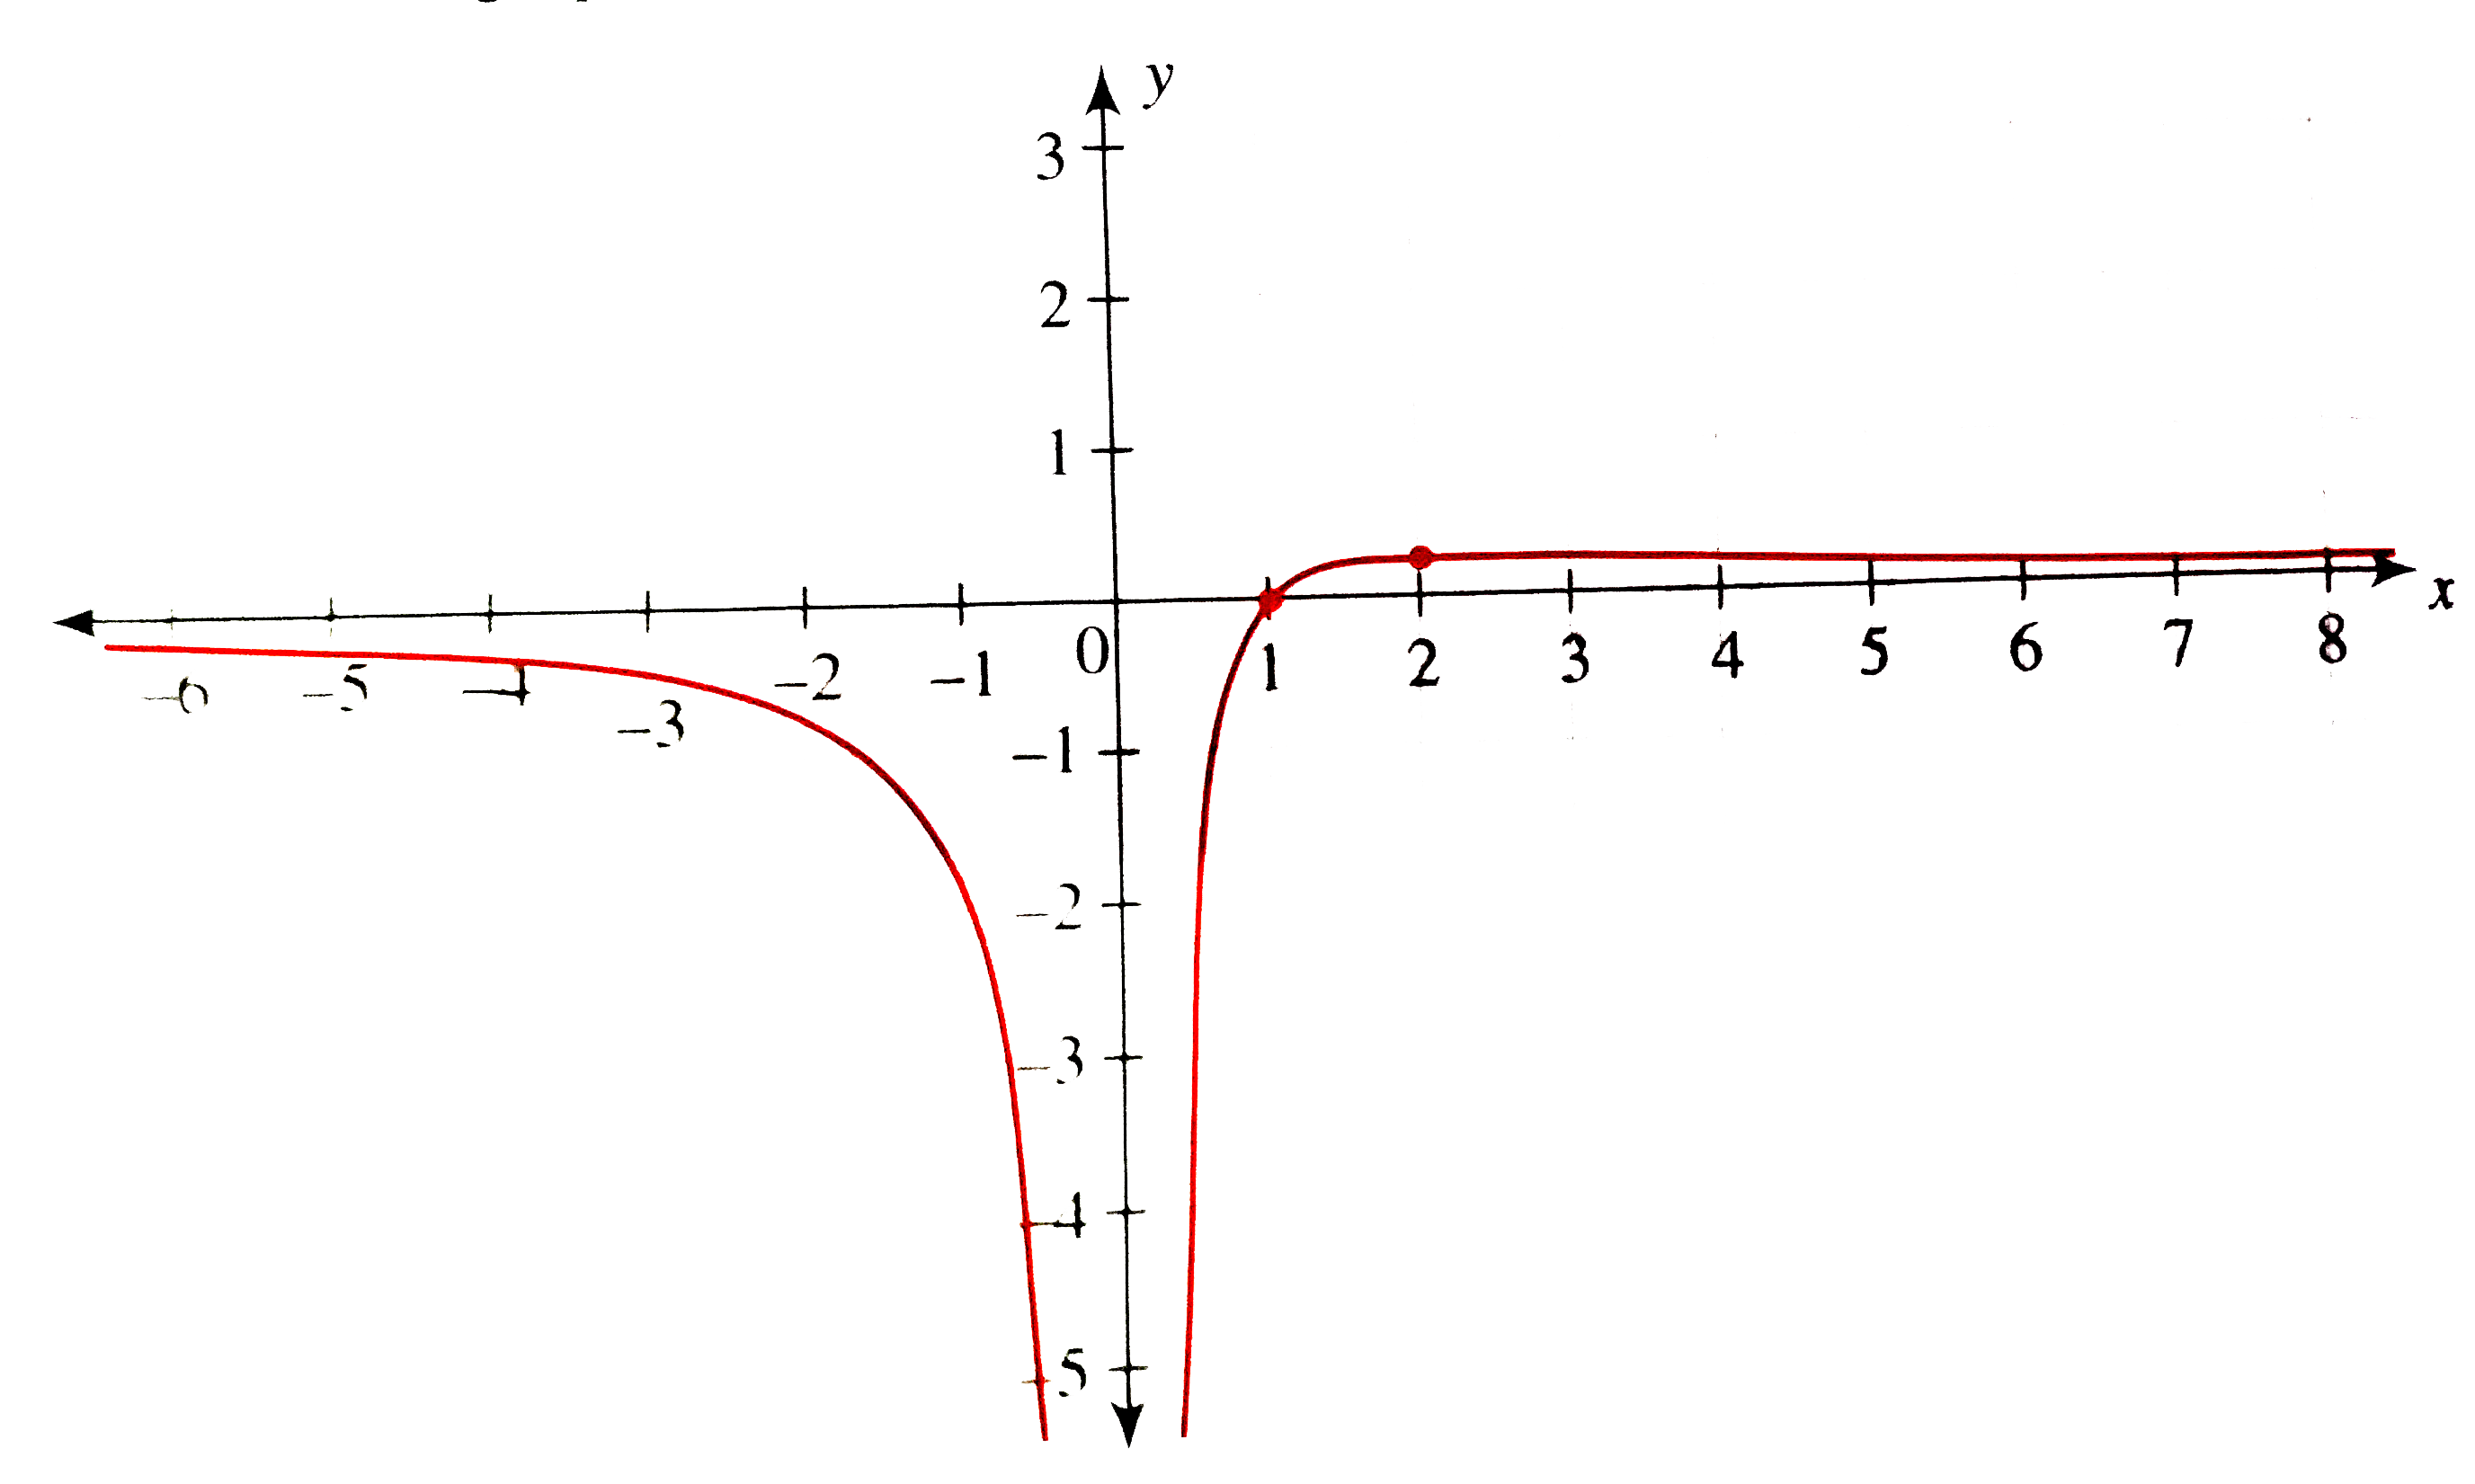
When x→−∞,y→0 and when x→0−,y→−∞. So f(x) decreases from '0' to '−∞' in (−∞,0).
When x→0+,y→−∞, so f(x) increases from '−∞' ot '1/4', intersecting the x-axis at (1, 0).
f(x) attains the maximum value at x = 2 and then decreases to approach '0' as x approaches '∞' as limx→∞x−1x2=0.
Thus , the graph of y=f(x) is as shown in the following figure.

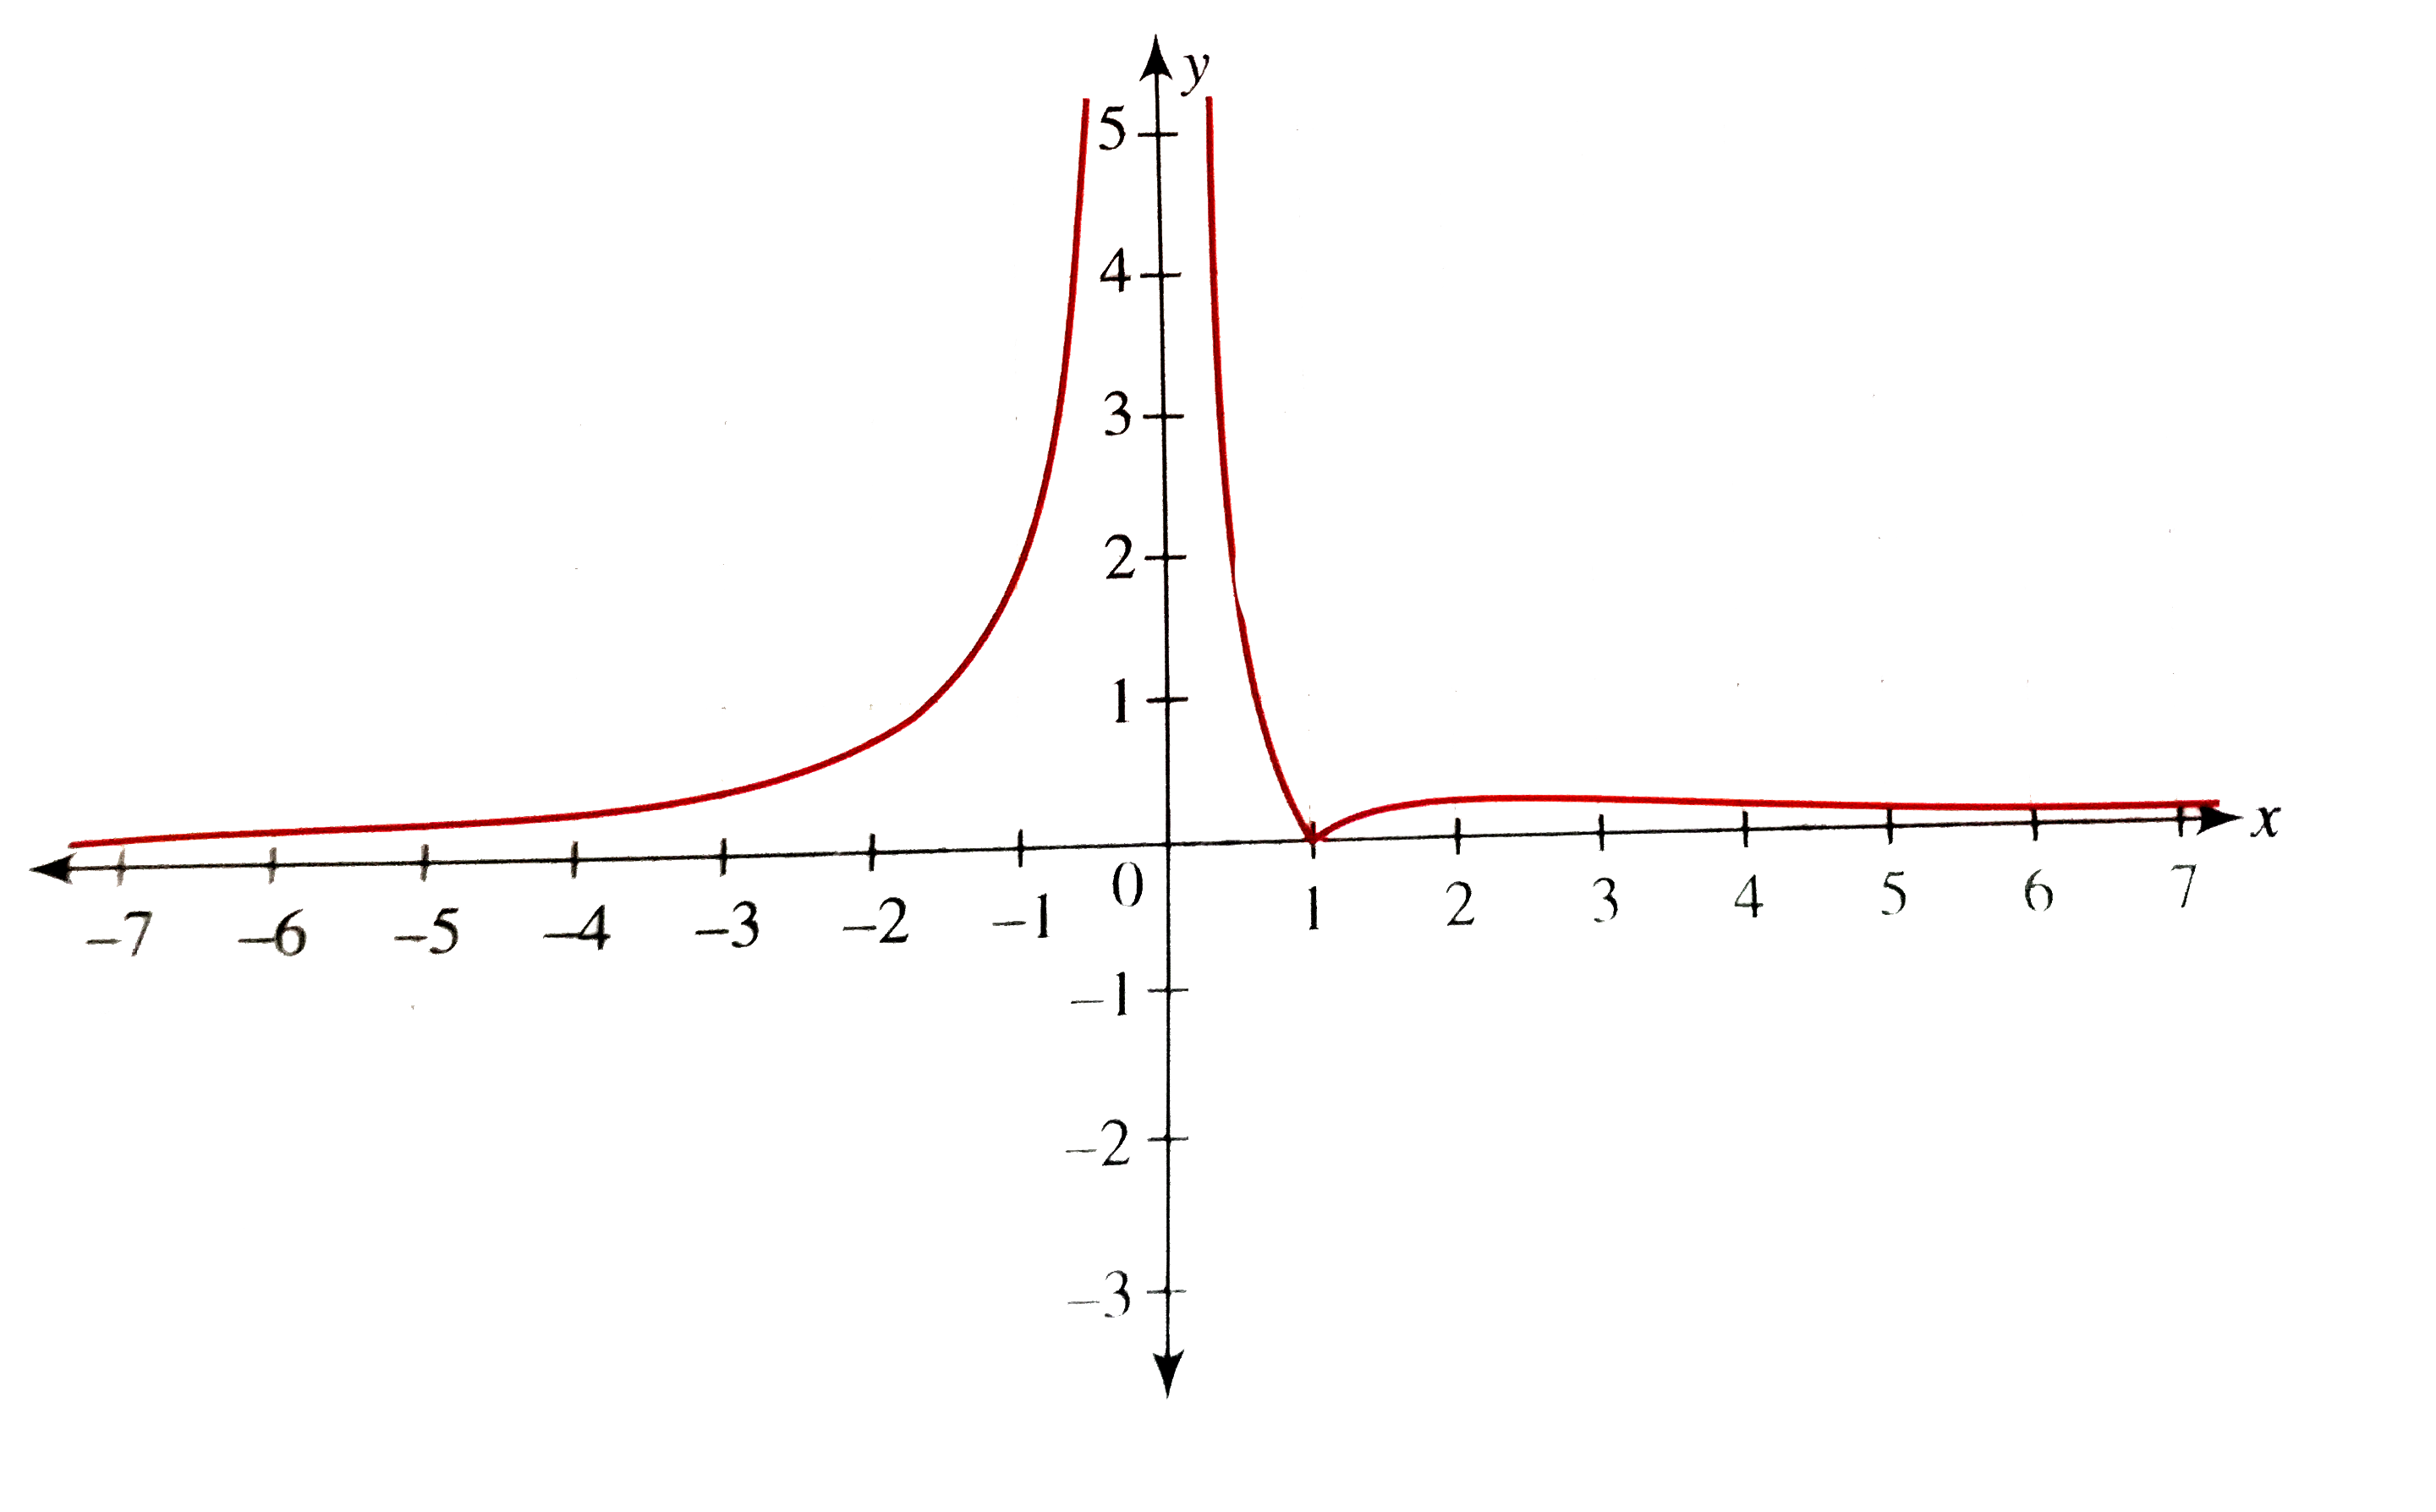
To draw the graph of y=g(x)=|x−1|x2=|f(x)|, flip the portion of the graph which is below the x-axis over the x-axis.
So the graph of y = g(x) is as follows .

Topper's Solved these Questions
- GRAPHS OF POLYNOMIAL AND RATIONAL FUNCTIONSBOOK - CENGAGE PUBLICATIONCHAPTER - GRAPHS OF POLYNOMIAL AND RATIONAL FUNCTIONSEXERCISE - Exercises
17 Videos
- GRAPHICAL TRANSFORMATIONSBOOK - CENGAGE PUBLICATIONCHAPTER - GRAPHICAL TRANSFORMATIONSEXERCISE - ILLUSTRATION
78 Videos
- GRAPHS OF ELEMENTARY FUNCTIONS BOOK - CENGAGE PUBLICATIONCHAPTER - GRAPHS OF ELEMENTARY FUNCTIONS EXERCISE - EXERCISES
34 Videos
Similar Questions
Draw the graph of y=(x−1)(x2−x+1).
View SolutionPlot y=|x|,y+x−2∣,andy=|x|2∣
View SolutionDraw the graph of y=1(1/x).
View SolutionDraw the graph of y=x−1x2 and hence the graph of y=|x−1|x2.
View SolutionDraw the graph of y=1−x21+x2 and hence draw the graph of y=cos−1.1−x21+x2.
View SolutionDraw the graph of y=3x−x31−3x2 and hence the graph of y=tan−1.3x−x31−3x2.
View SolutionDraw graph of y=1x2−x.
View SolutionDraw the graph of y=x−1x−2.
View SolutionDraw the graph for |y|=(x−1)(x−2).
View SolutionDraw the graph of y=x−1x2 and hence the graph of y=|x−1|x2.
View SolutionDraw the graph of y=1−x21+x2 and hence draw the graph of y=cos−1.1−x21+x2.
View SolutionDraw graph of y=1x2−x.
View SolutionDraw the graph of y=x−1x−2.
View SolutionDraw the graph for |y|=(x−1)(x−2).
View SolutionDraw the graph of y=(1-x^(2))/(1+x^(2)) and hence draw the graph of y=cos^(-1).(1-x^(2))/(1+x^(2)) .
View SolutionDraw the graph of y=(3x-x^(3))/(1-3x^(2)) and hence the graph of y=tan^(-1).(3x-x^(3))/(1-3x^(2)) .
View Solution
