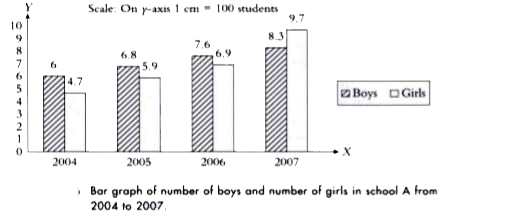
Find the ratio between the number of students in the year 2006 and in 2007.
107:145
127:145
29:36
107:127
The correct Answer is:C
Step by step video, text & image solution for Find the ratio between the number of students in the year 2006 and in 2007. by Maths experts to help you in doubts & scoring excellent marks in Class 8 exams.
Topper's Solved these Questions
- BOOK - PEARSON IIT JEE FOUNDATIONCHAPTER - STATISTICS EXERCISE - CONCEPT APPLICATION (LEVEL II)29videos
STATISTICS
- BOOK - PEARSON IIT JEE FOUNDATIONCHAPTER - STATISTICS EXERCISE - TEST YOUR CONCEPTS ( ESSAY TYPES QUESTIONS)5videos
STATISTICS
- BOOK - PEARSON IIT JEE FOUNDATIONCHAPTER - SQUARES AND SQUARE ROOTS AND CUBES AND CUBE ROOTS EXERCISE - Level 37videos
SQUARES AND SQUARE ROOTS AND CUBES AND CUBE ROOTS
- BOOK - PEARSON IIT JEE FOUNDATIONCHAPTER - TIME AND DISTANCE EXERCISE - Concept Application (Level 2 )3videos
TIME AND DISTANCE
Similar Questions
No. of students and % of students passed out of those who appeared are given for two subjects from year 2011 to 2015 in a college XYZ.
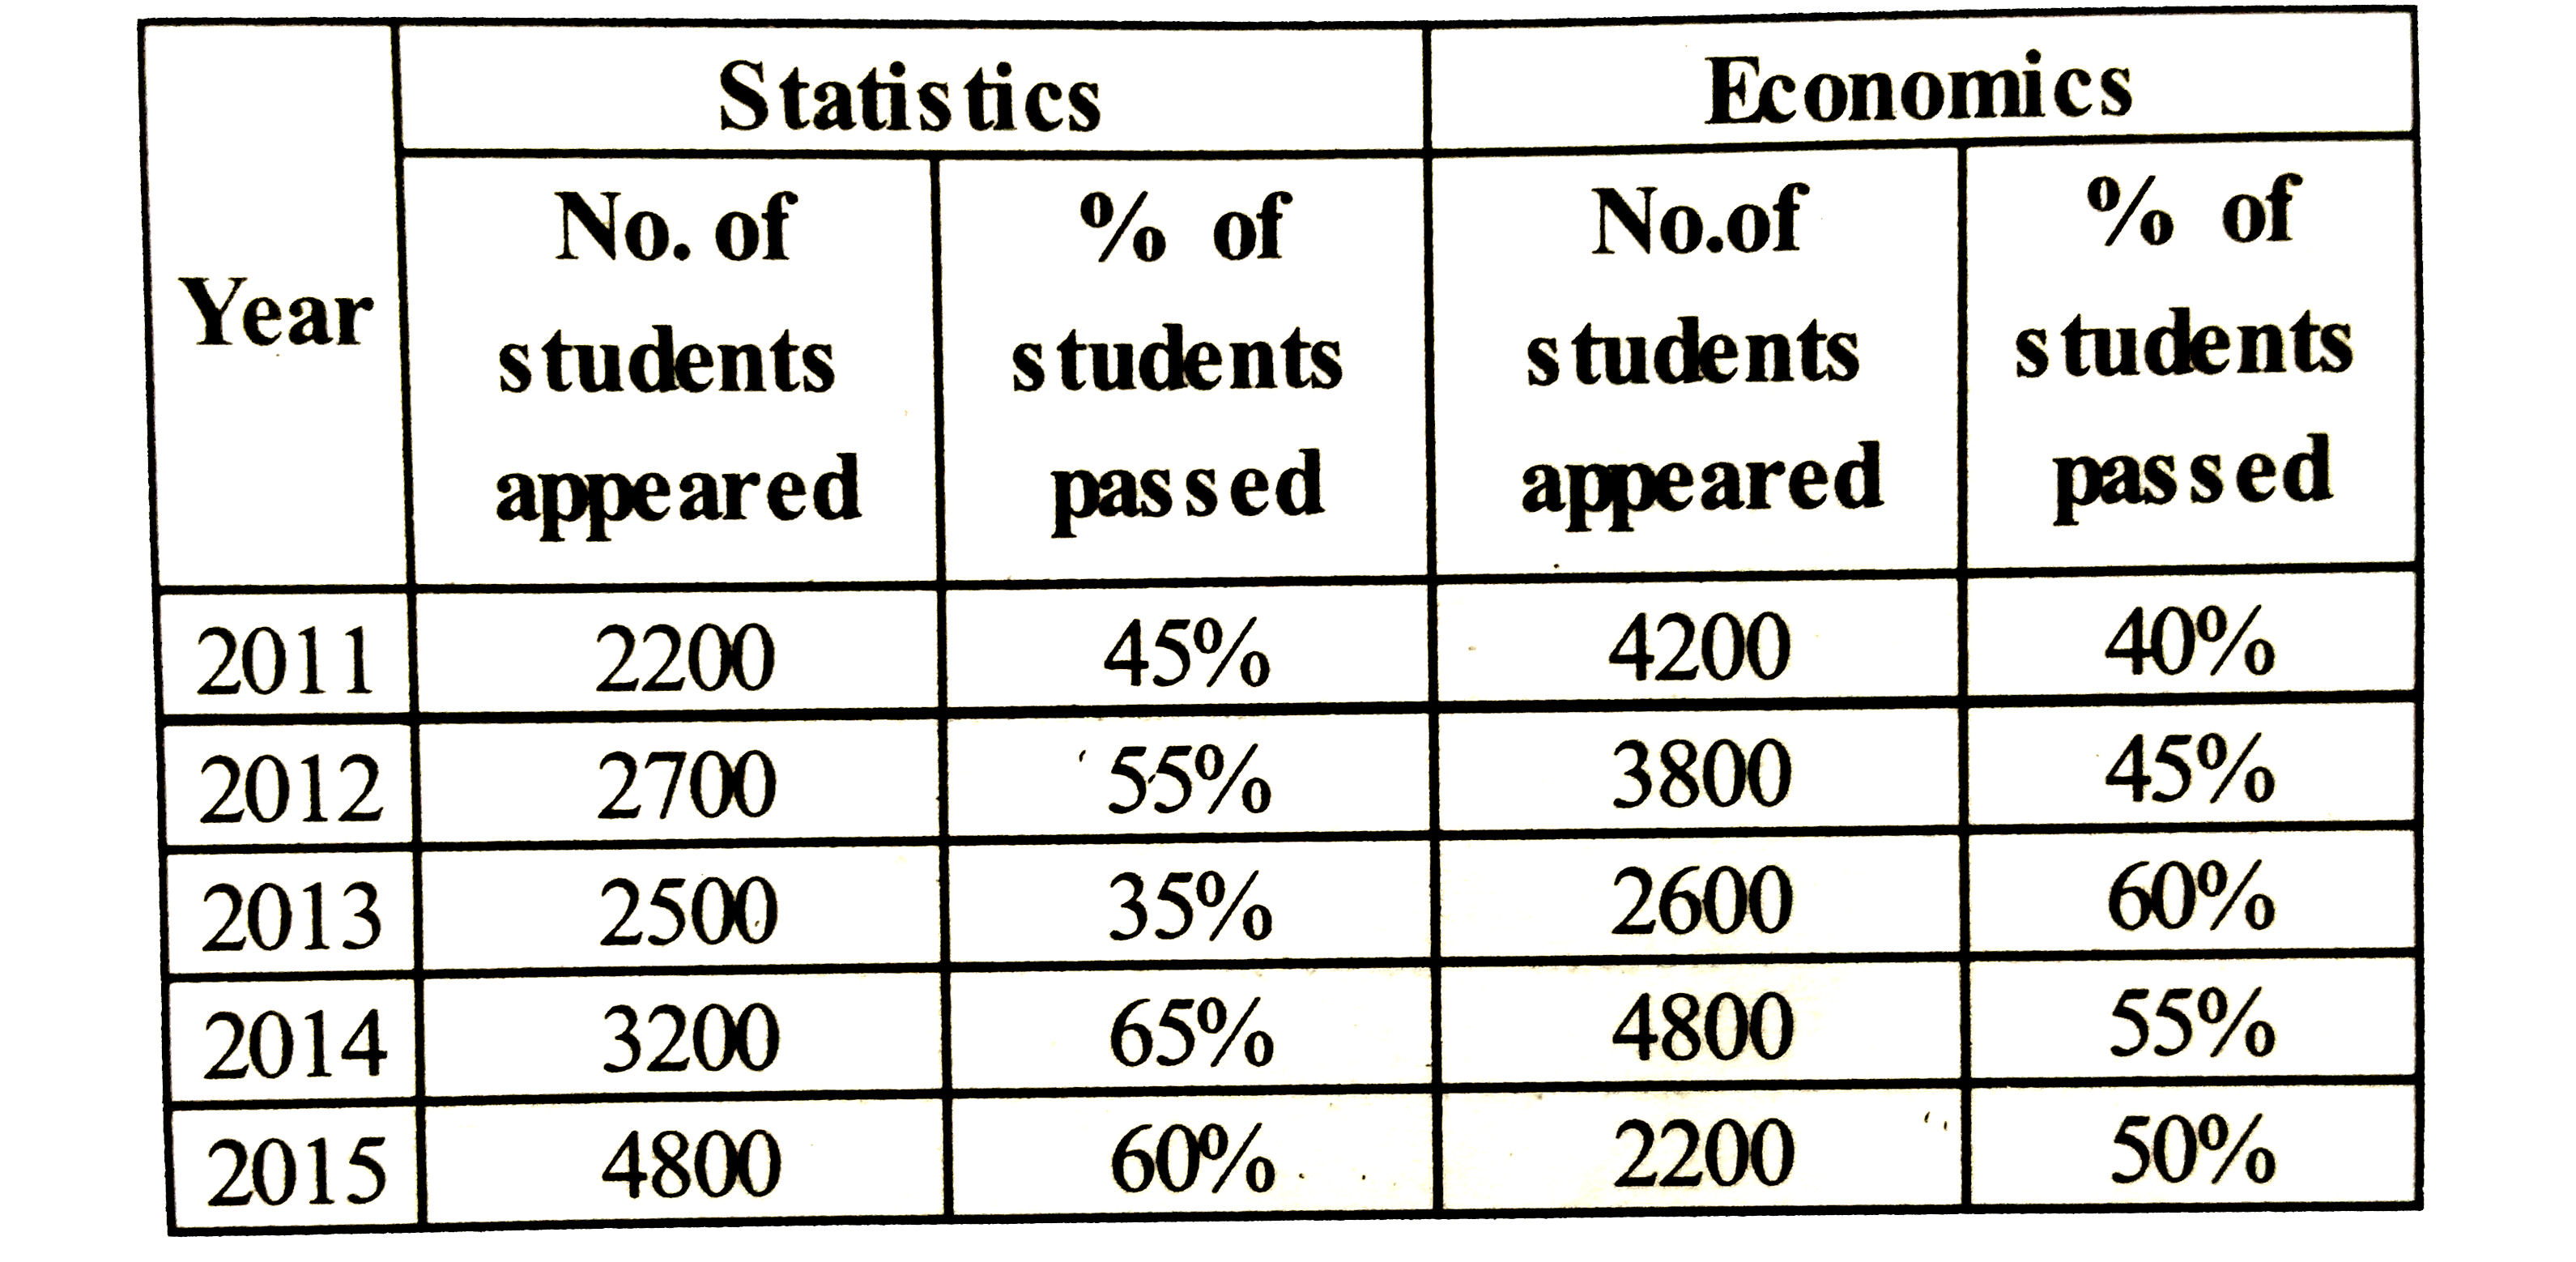
Find the ratio between the total number of students appeared in Economics from 2012 to 2014 togeter and the total number of students appeared in Satistics from year 2013 to 2015 together ?View SolutionDirections for questions : These questions are based on the following data. Read the following bar graph and answer the questions.
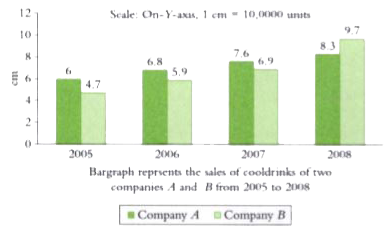
Find the ratio of the total sales in the year 2007 and that in 2008.View Solution
Knowledge Check
- Question 1 - Select One
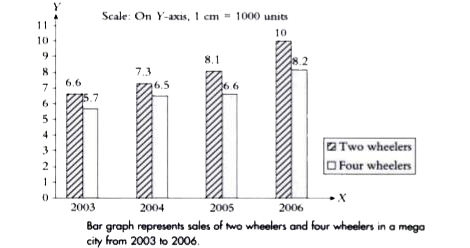
Find the ratio between number of vehicles sold in the year 2004 and in the year 2006.A41:46B69:91C147:182D46:49 - Question 2 - Select One
The bar chart given below shows the number of students (in '00) in a schoool from year 2000 to year 2004.
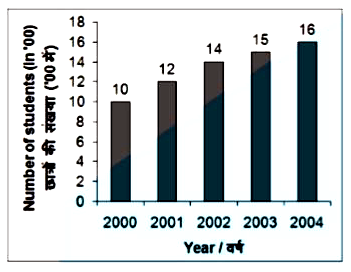
What is the difference between the total number of students in year 2004 and 2000?AA)1600BB)1000CC)800DD)600 - Question 3 - Select One
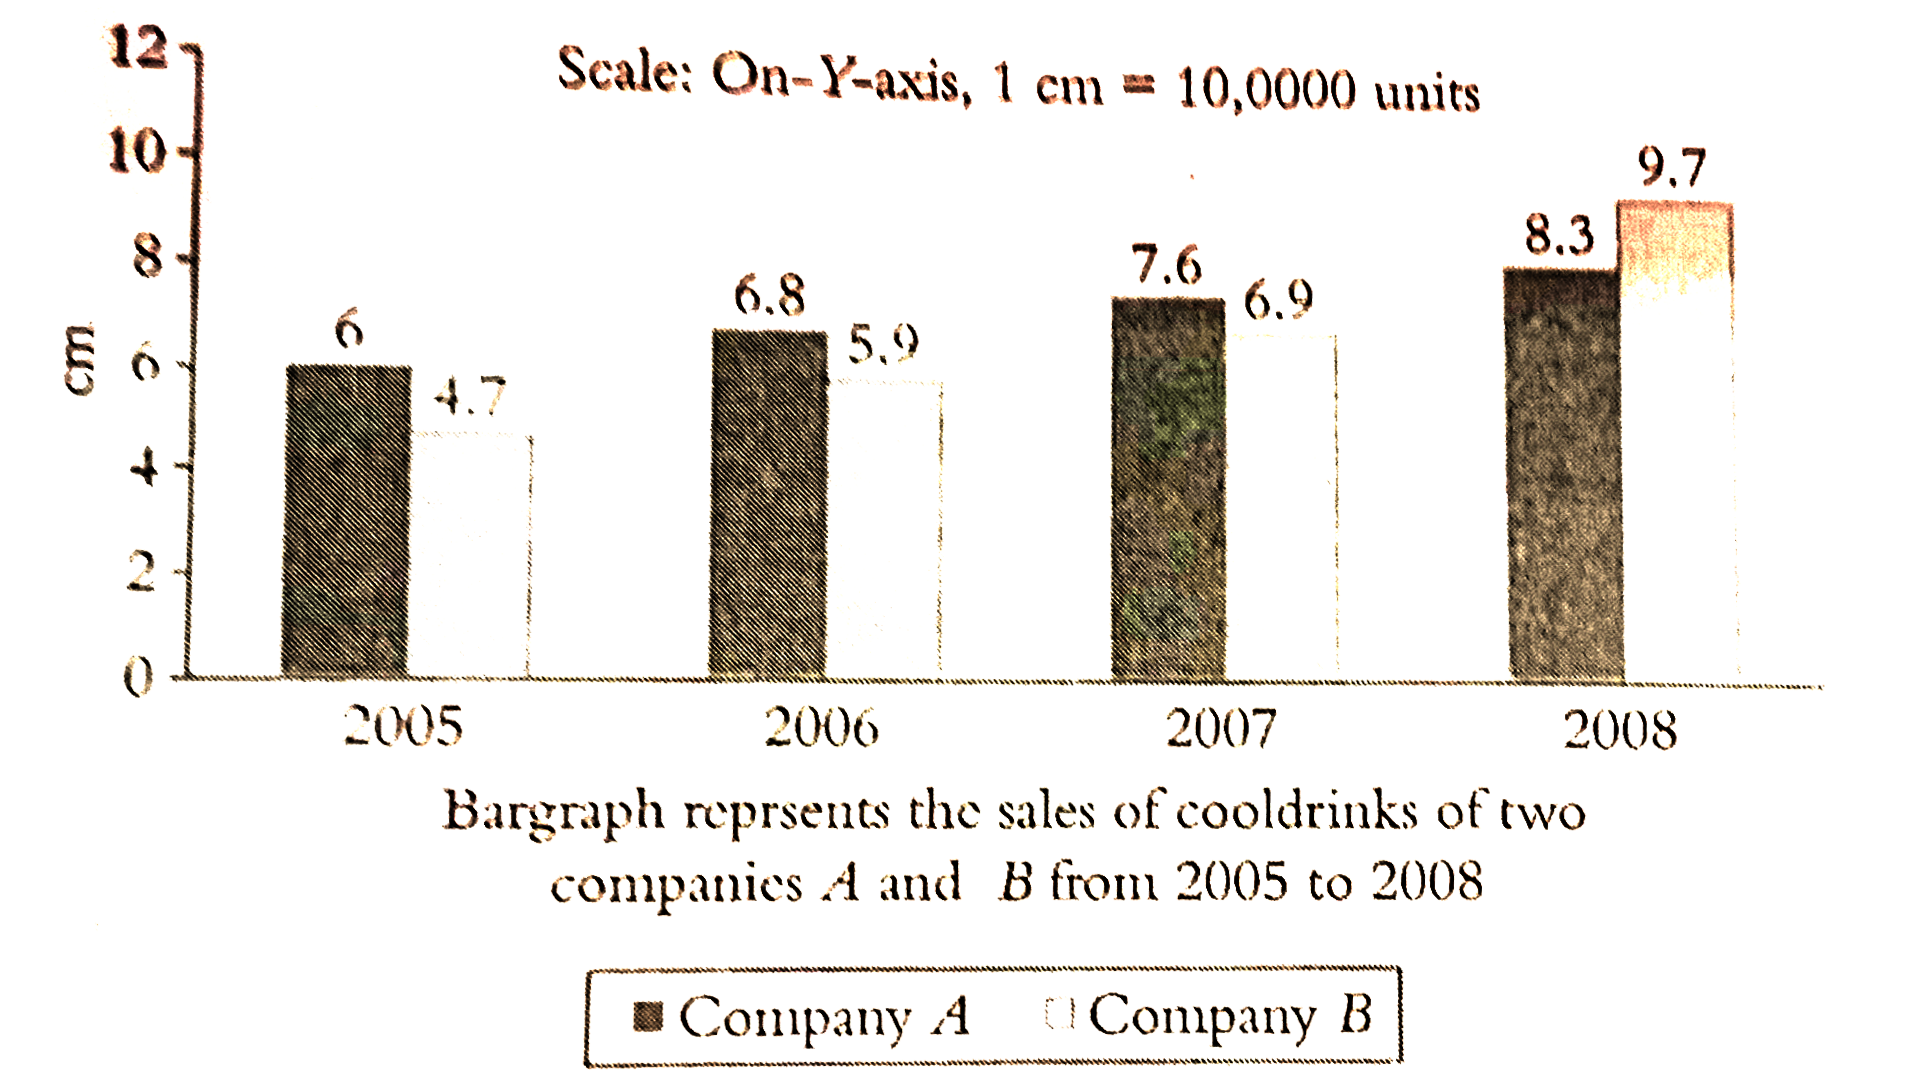
Find the ratio of the total sales in the year 2007 and that in 2008.A107:145B127:145C29:36D107:127
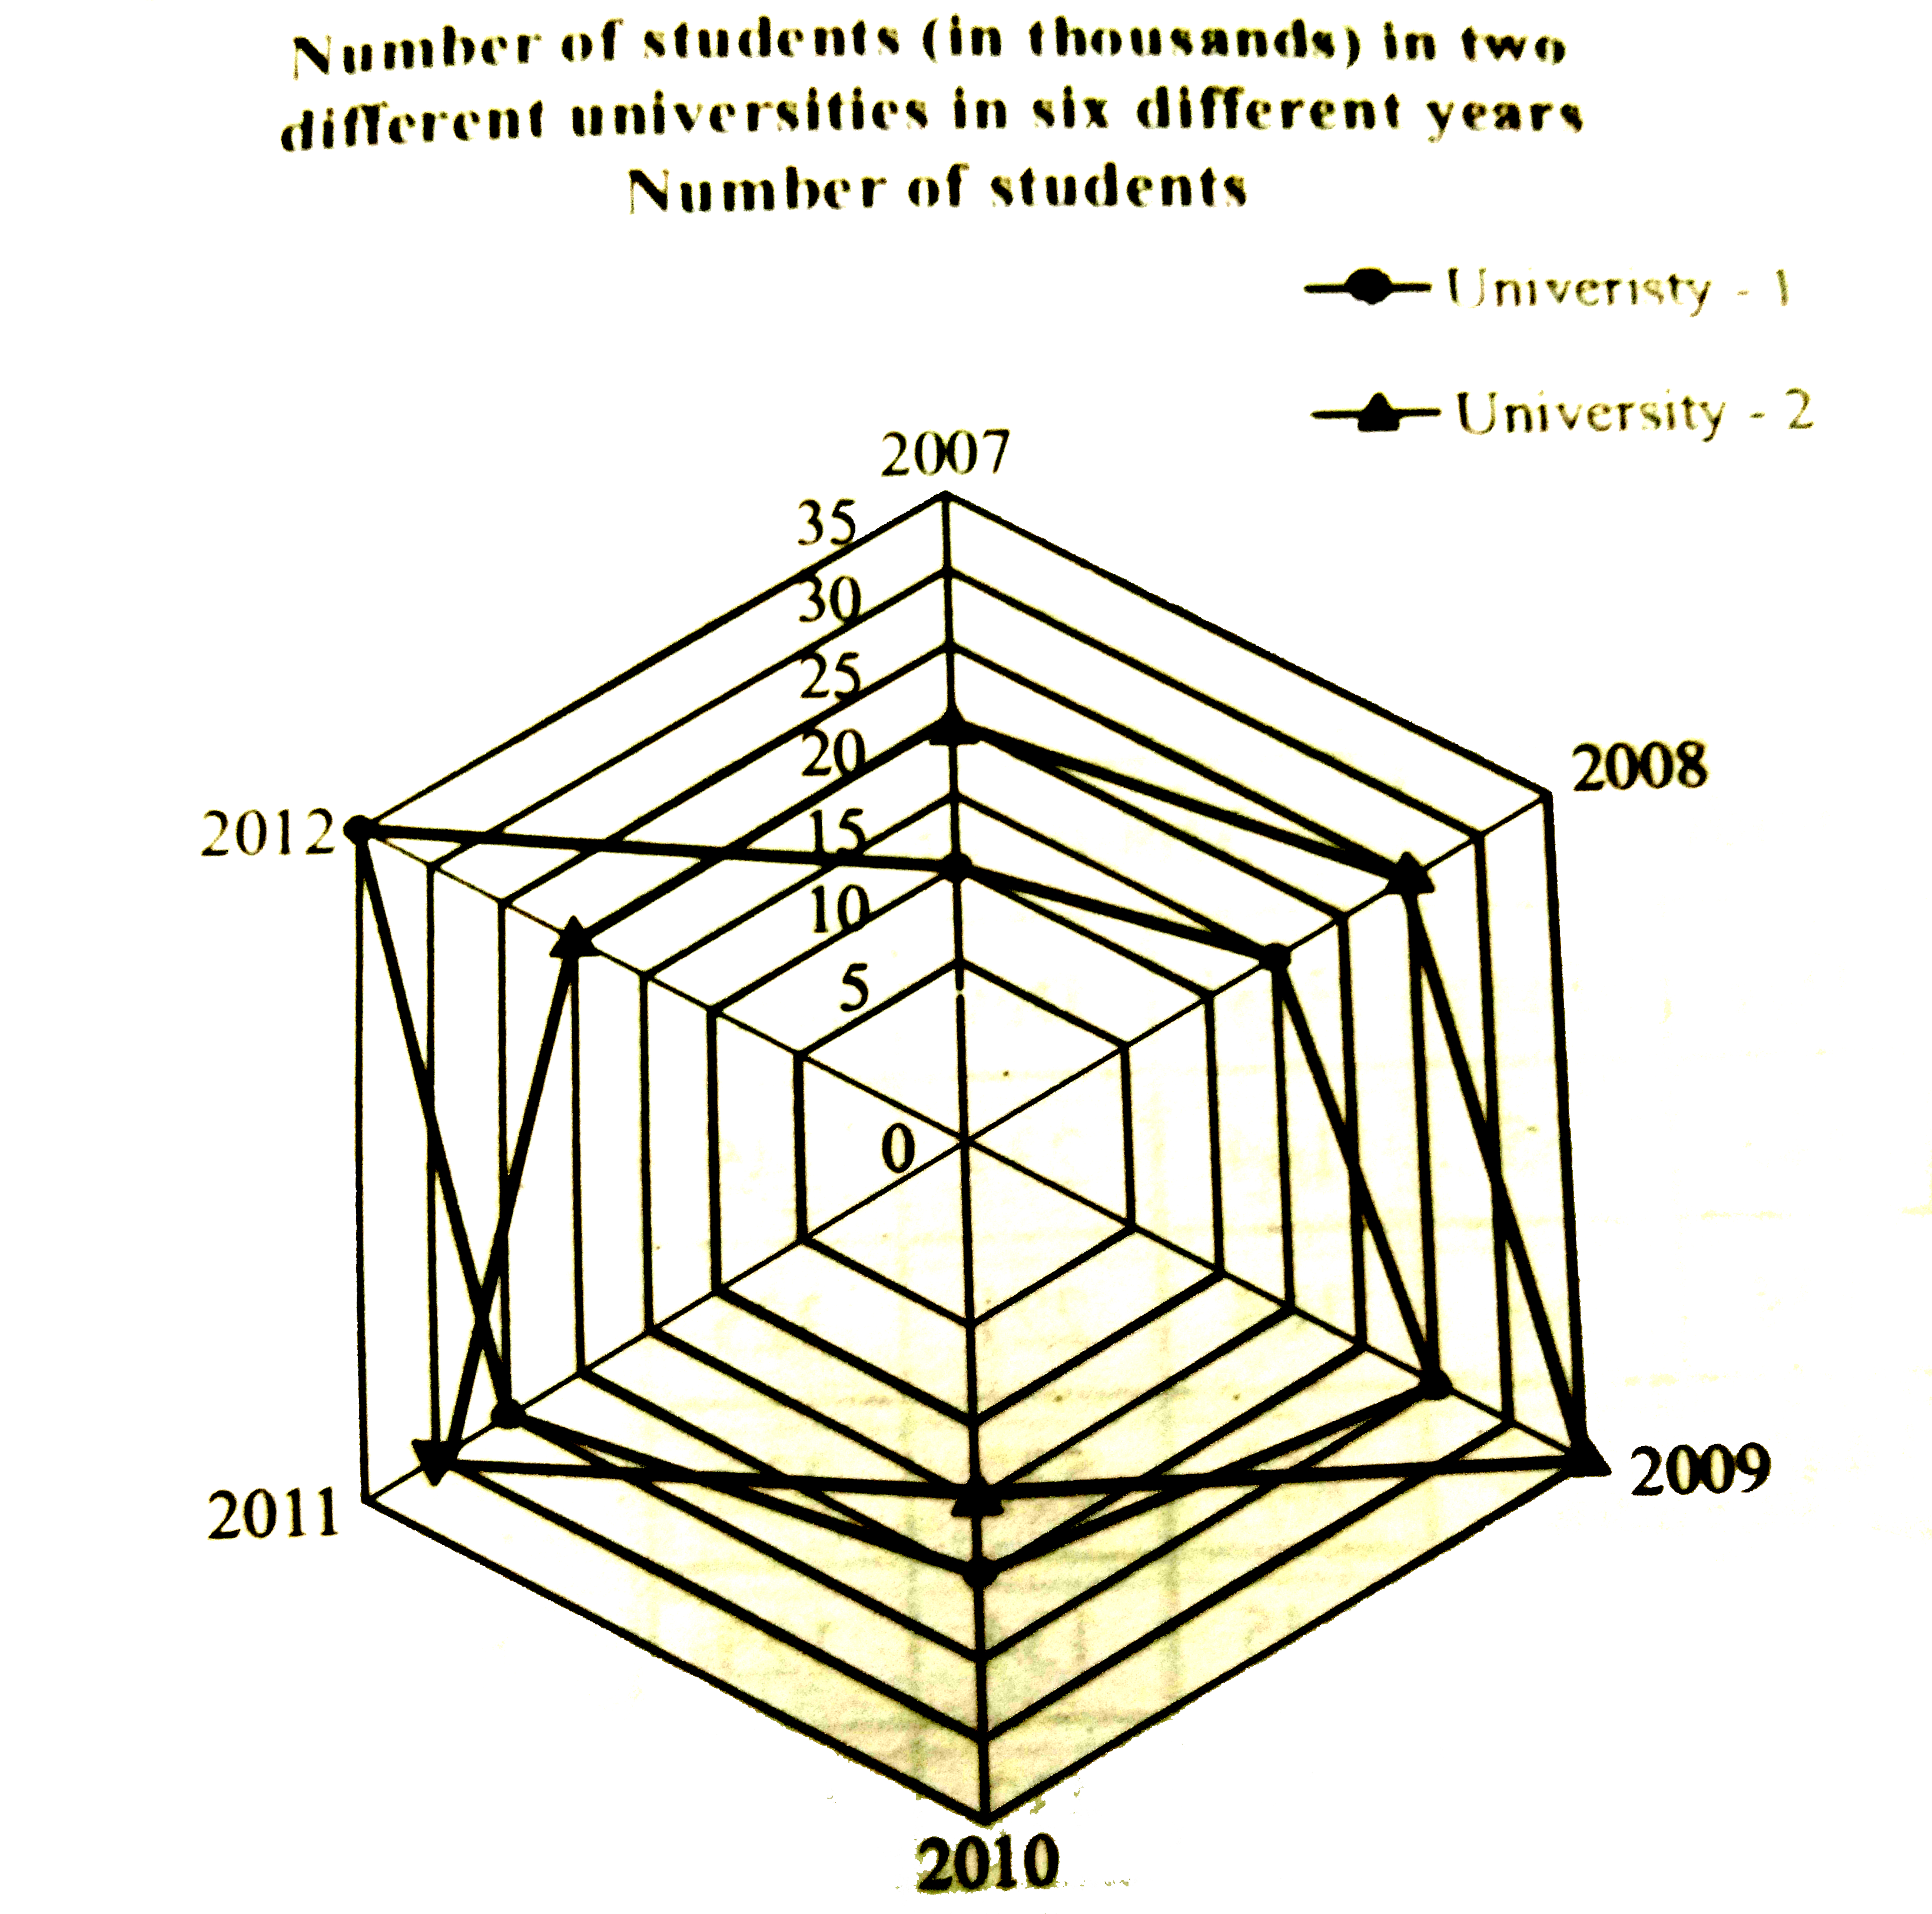
What was the difference between the number of students in university-1 in the year 2010 and the number of students in university-2 in the year 2012 ?View Solution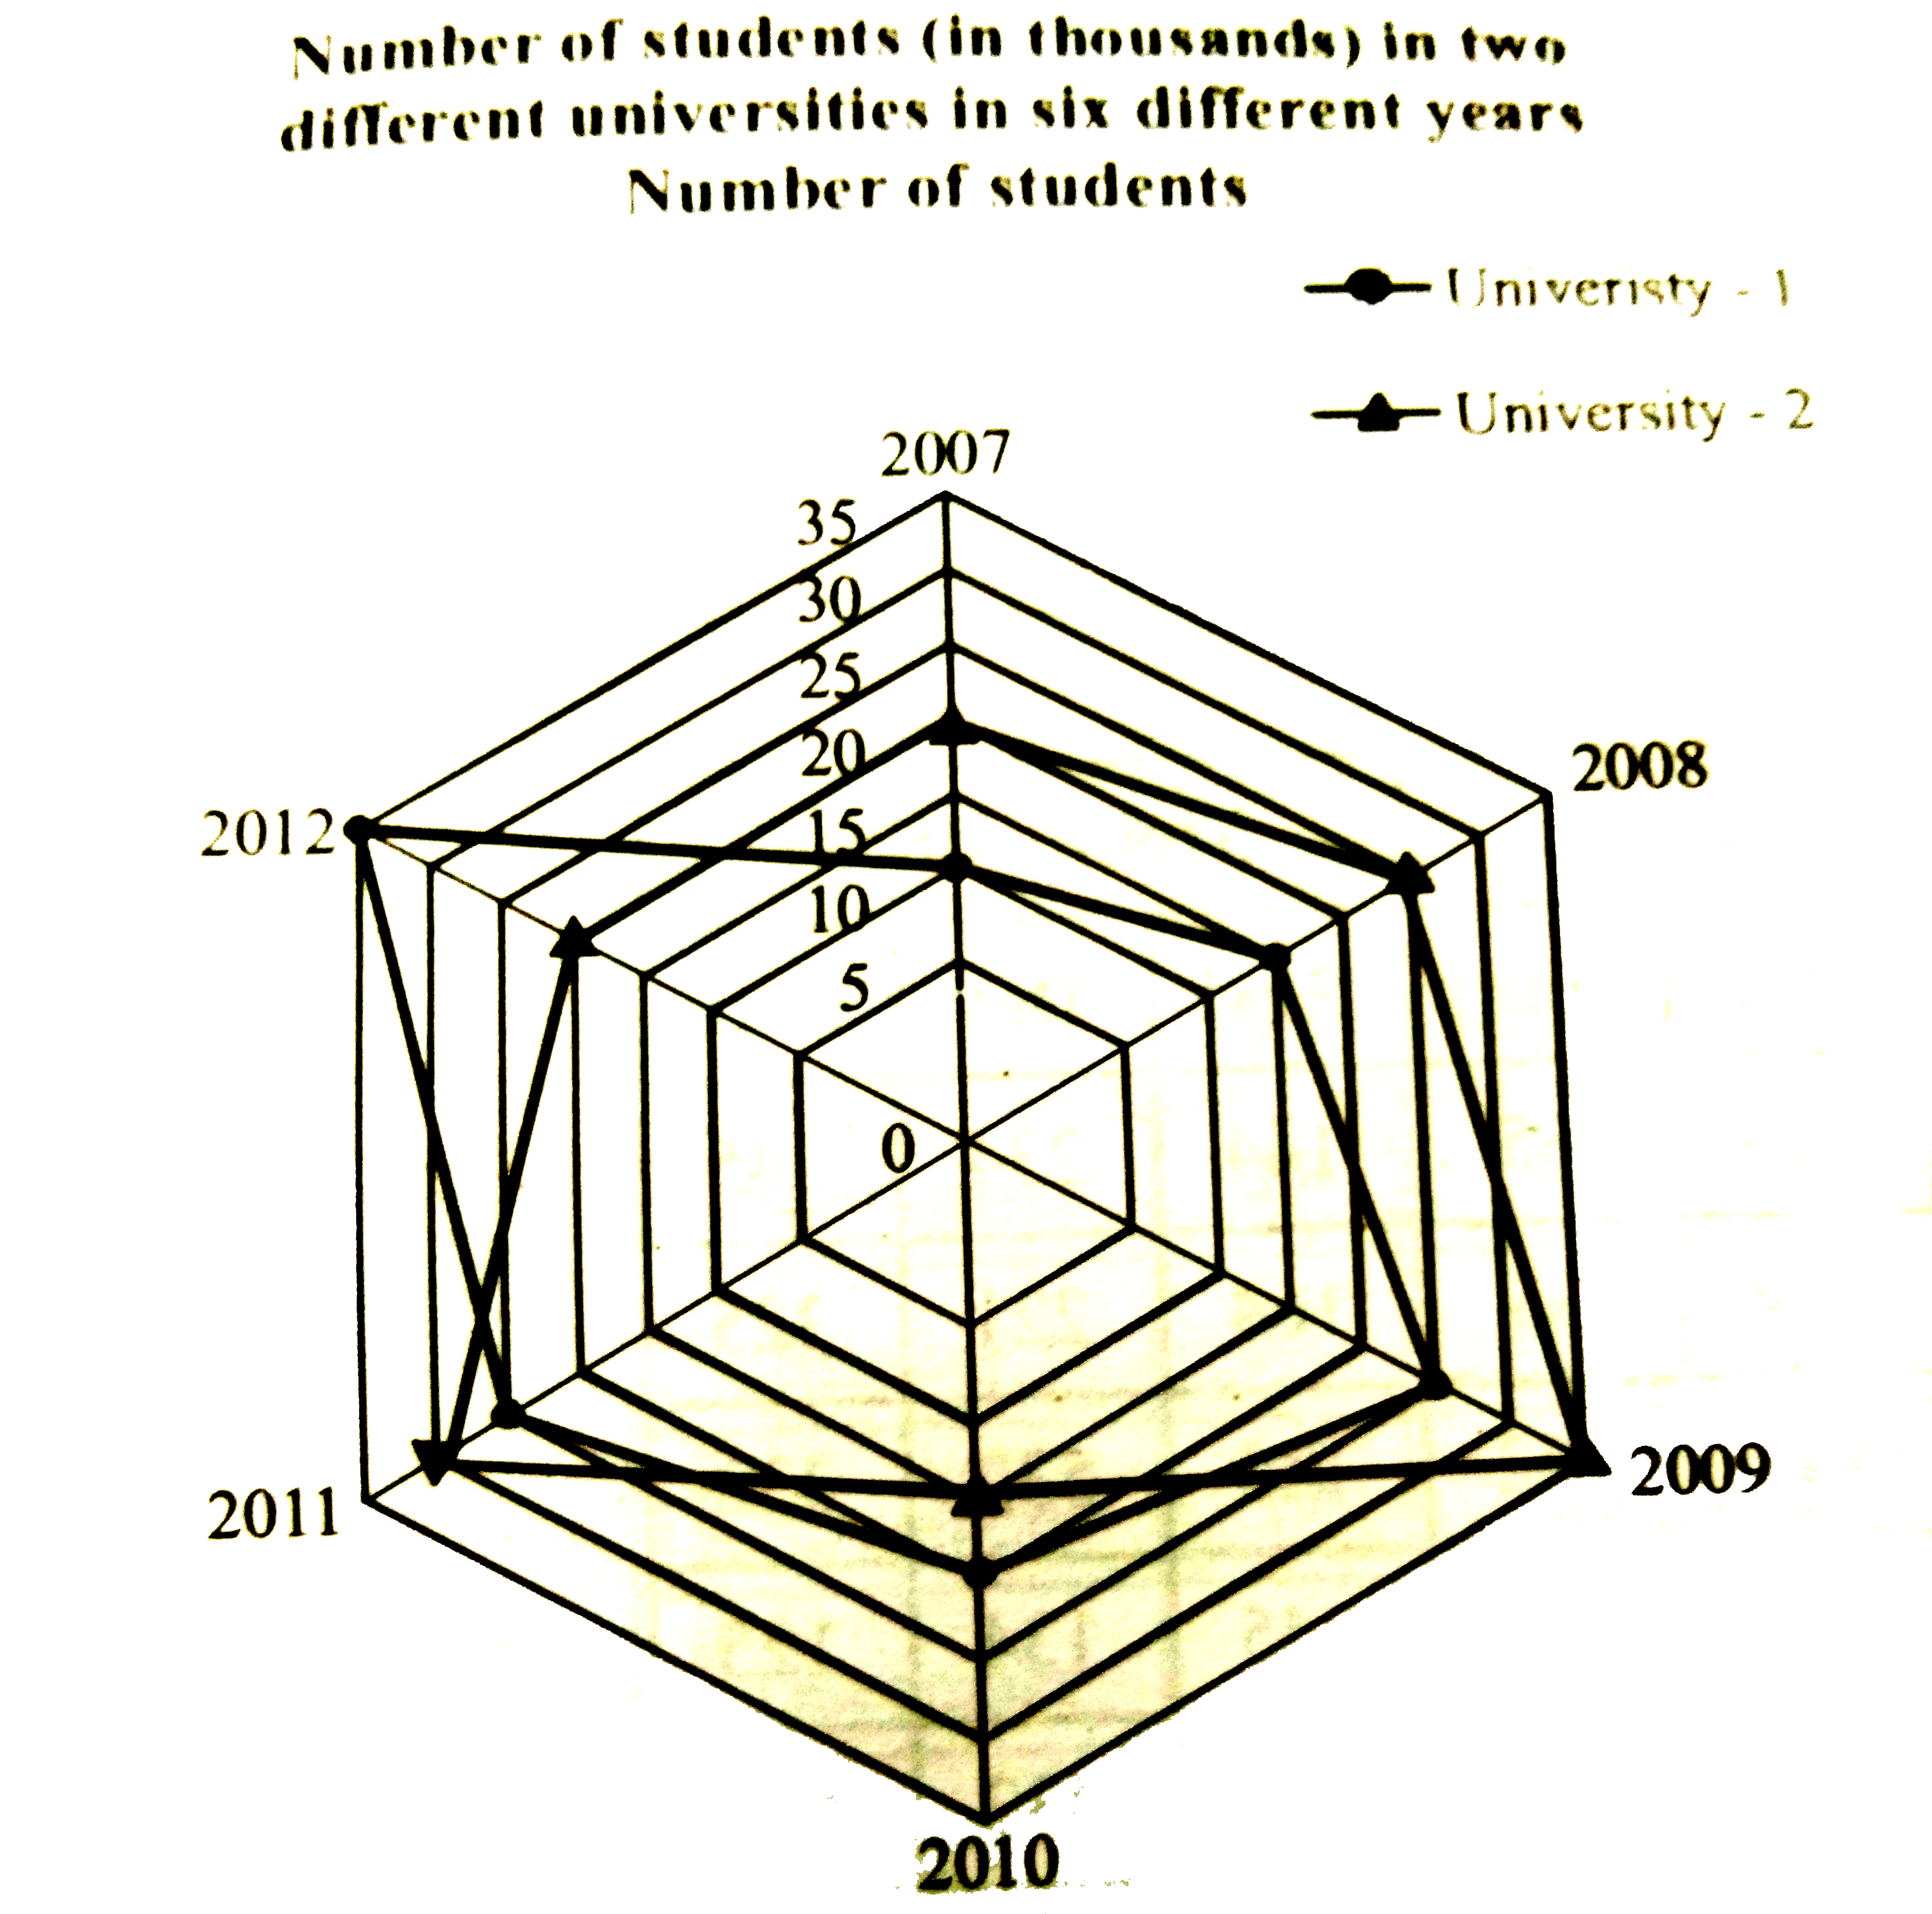
What is the sum of the number of students in university-1 in the year 2007 and the number of students in university-2 in the year 2011 together ?View Solution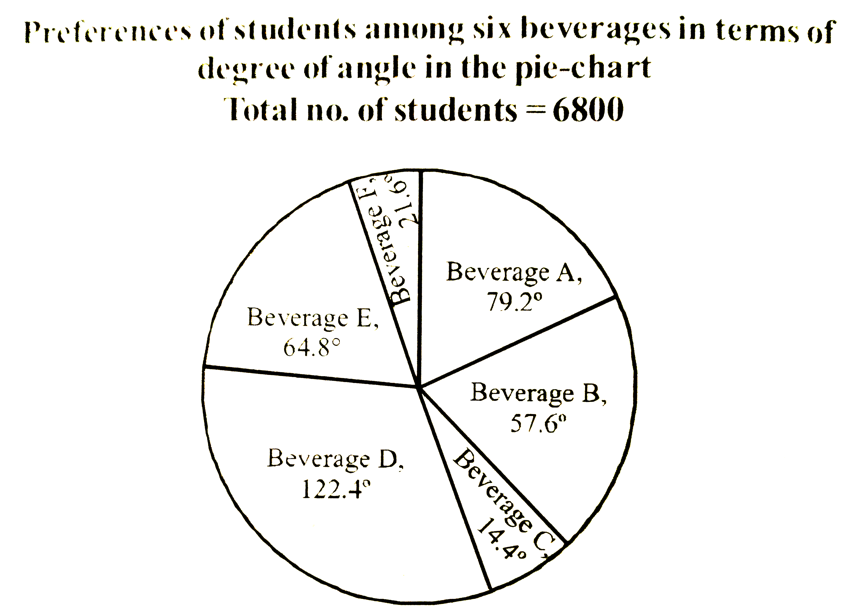
What is the respective ratio between the number of students who prefer Beverage F and the number of students who prefer Beverage A ?View SolutionThe bar graph shows the number of students (in hundreds) admitted and passed out per year in a college during the years 2010 to 2014.
Study the bar graph and answer the question.
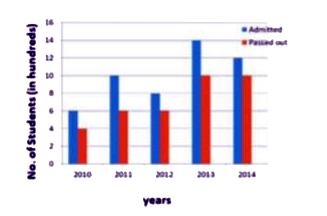
The ratio of the number of students admitted in the year 2012 to the average number of students passed out inthe years 2013 and 2014 isView SolutionStudy the following multiple bar graph carefully and answer the questions.
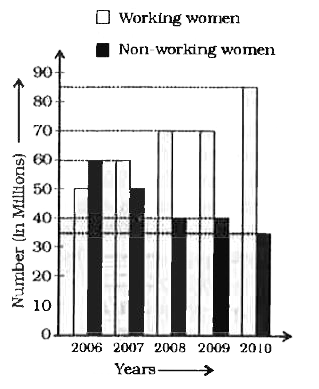
What is the ratio of the number of women working in the year 2006 to the number of women working in the year 2010 ?View Solution

