एक राज्य में 8 वर्षो में हुए चावल उत्पादन (लाख टन) के आँकड़े निम्नलिखित है
84 . 98, 93.34, 71.82, 88.53, 83.13, 91.79, 93.36, 96.69
इन आँकड़ों का औसत ज्ञात कीजिए।
The correct Answer is:87.95 लाख टन
Step by step video, text & image solution for एक राज्य में 8 वर्षो में हुए चावल उत्पादन (लाख टन) के आँकड़े निम्नलिखित है 84 . 98, 93.34, 71.82, 88.53, 83.13, 91.79, 93.36, 96.69 इन आँकड़ों का औसत ज्ञात कीजिए। by Maths experts to help you in doubts & scoring excellent marks in Class 10 exams.
Similar Questions
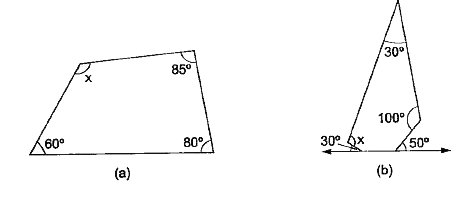
निम्नलिखित आकृतियों में x के मान ज्ञात कीजिए

 07:24View Solution
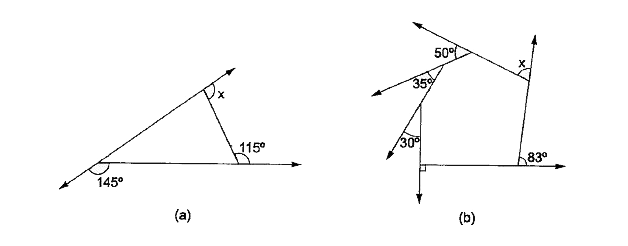
निम्नलिखित आकृतियों में x के मान ज्ञात कीजिए
 03:08View Solution
एक ठोस का दूसरे ठोस में रूपांतरण|विगत वर्षो में आये हुए प्रश्न
52:35View Solutionआँकड़ों का प्रबंधन #!#आँकड़े क्या हैं ? #!#एक परिचय
View SolutionThe bar graph given below shows the wheat production (in tonnes) of a large farm during the year 2011-2018. In how many years was wheat production higher than the average production of the period? नीचे दिए गए दंड आरेख में वर्ष 2011-2018 के दौरान किसी बड़े फार्म के गेहूं उत्पादन (टन में) को दर्शाया गया है | अवधि के औसत उत्पादन की तुलना में दिए गए कितने वर्षो में गेहूं उत्पादन अधिक था ?
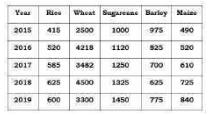
02:22View SolutionIn the following table, the production of various crops (in tonnes) is given from 2015 to 2019. Study the table and answer the question that follows:
दी गयी तालिका में, 2015 से 2019 तक विभिन्न फसलों का उत्पादन (टन में ) दिया गया है | इस तालिका का अध्ययन करें तथा फिर पूछे गए प्रश्न का उत्तर दीजिए | The difference (in tonnes) between the average production of barley and average production of rice is:
जौ के औसत उत्पादन तथा चावल के औसत उत्पादन के बीच क्या अंतर (टन में ) है?04:05View Solutionनिम्नलिखित यौगिकों पर विचार कीजिए घटते क्रम में इन यौगिकों की क्षारकता का क्रम है -
View Solution

