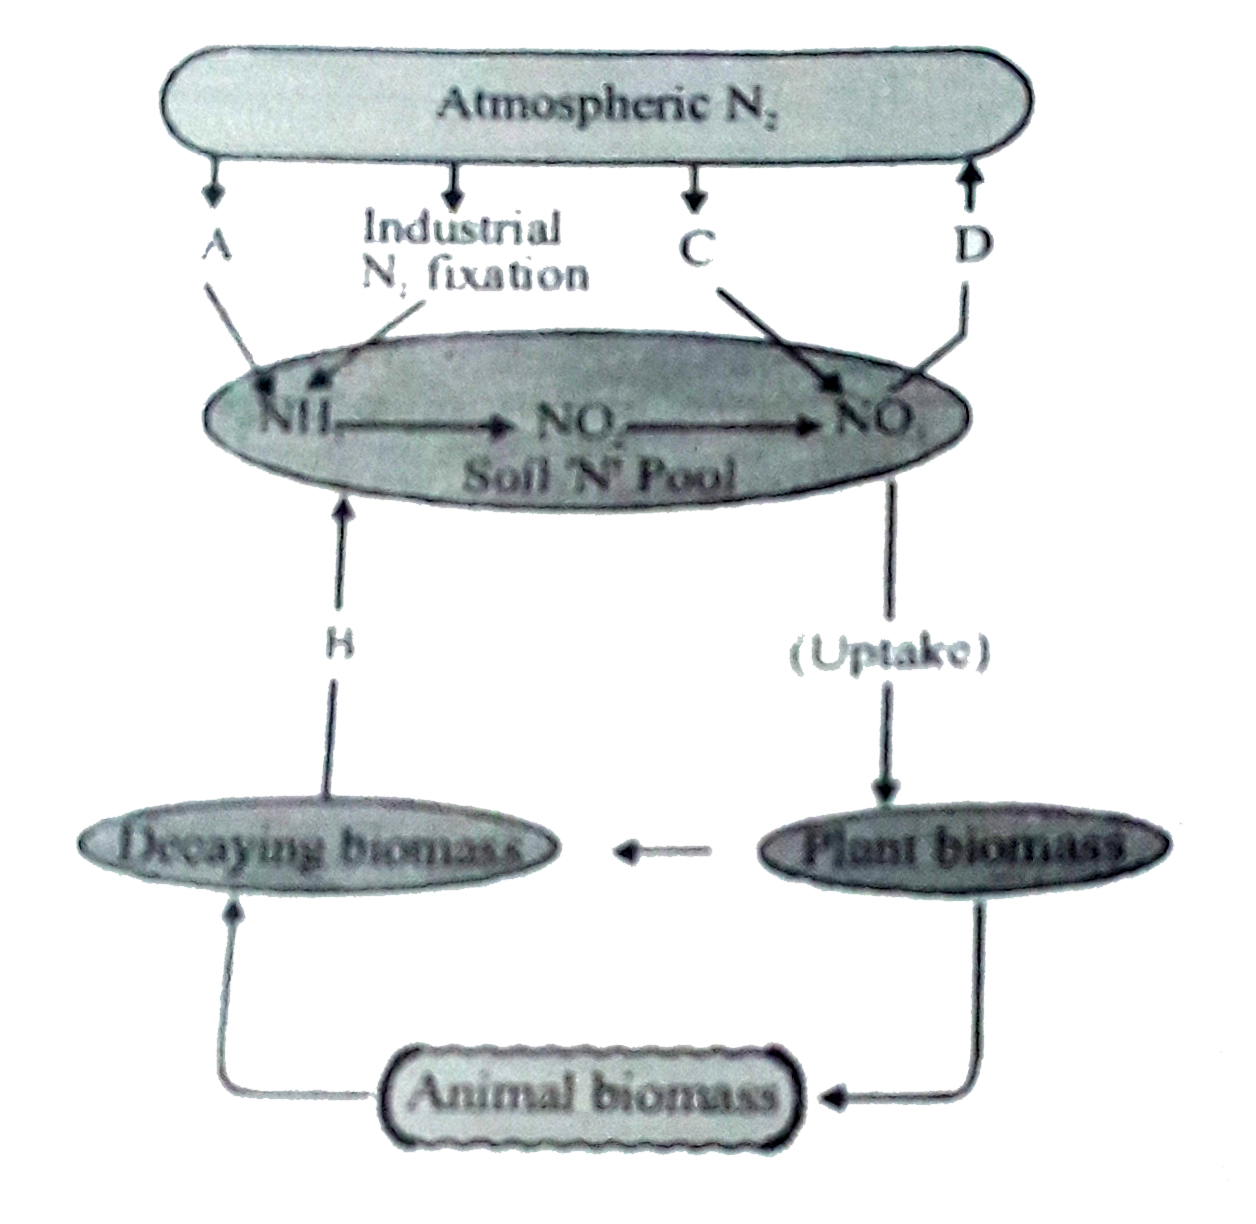
With a graphic representation show the relationship between three main nitrogen pools, atmospheric soil and biomass.Solution in Punjabi
Step by step video & image solution for With a graphic representation show the relationship between three main nitrogen pools, atmospheric soil and biomass. by Biology experts to help you in doubts & scoring excellent marks in Class 11 exams.
Updated on:21/07/2023Topper's Solved these Questions
Similar Questions
Name the mineral constituent of cell wall.
View SolutionWrite examples of plants which exhibit haplontic life cycle.
View SolutionF0−F1 particles participate in the synthesis of ………………
View SolutionGraphic representation of biomass relationship between the producer and consumer in an ecosystem is called:
View SolutionGraphic representation indicating evolutionary relationships of group is
View SolutionStudy the given figure of nitrogen cycle that shows the relationship between the three main nitrogen pools-atmosphere, soil and biomass and find labelled part A,B,C & D

View SolutionExplain the experimental verification of Boyle's law along with the graphical representations of PV relationship.
View SolutionIdentify the sequence of steps of nitrogen cycle showing relationship between the three main nitrogen pools-atmospheric, soil and and biomass.
View SolutionMention the sources of nitrogen pool in the soil.
View SolutionGraphical representation of population growth shows -
View SolutionThe true graphical representation of volume versus temperature relationship at constant pressure is :
View SolutionGraphical representation of biomass relationship between the producerand the consumers is called
View Solutionमृदा में वायुमंडलीय नाइट्रोजन का स्थिरीकरण कैसे होता है ?
View SolutionA geometric representation showing the relationship between a whole and its parts is a
View SolutionGraphic representation indicating evolutionary relationships of group is
View Solution
